Figure 1.

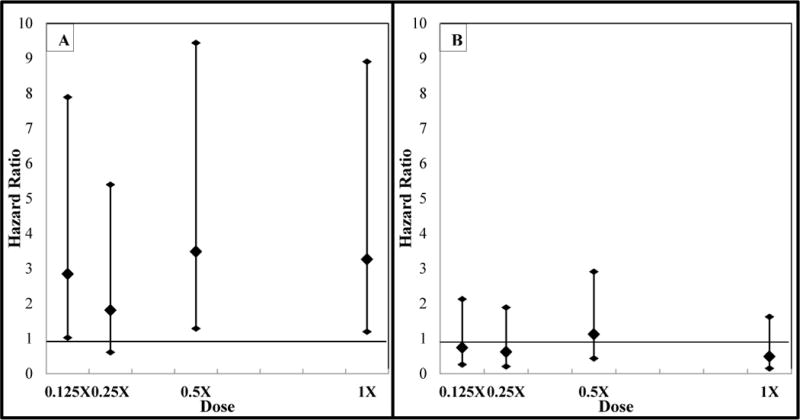
Dose response curve of the hazard ratios from 0.125X, 0.25X, 0.5X, and 1X dilution series of PLRRP water (A) before hatching and (B) after hatching. Error bars represent 95% confidence intervals.

Dose response curve of the hazard ratios from 0.125X, 0.25X, 0.5X, and 1X dilution series of PLRRP water (A) before hatching and (B) after hatching. Error bars represent 95% confidence intervals.