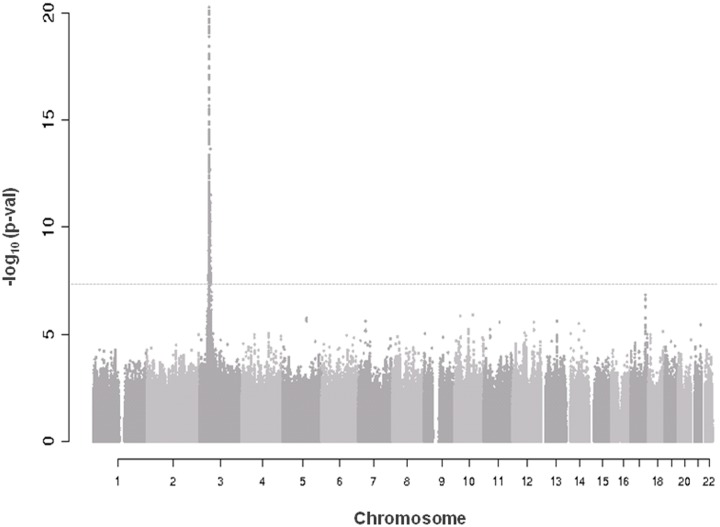
Fig 1. Manhattan plot of genome-wide association results in discovery analysis.
Truncated Manhattan Plot showing -log10(p-values) for all SNPs of the CRIPTO discovery GWAS ordered by their chromosomal position. The dashed horizontal line represents the threshold for genome-wide significance (p-value<5*10-8). SNPs associated at the genome-wide significance level are all located on chromosome 3 (lowest p-value = 1.03*10–159).

