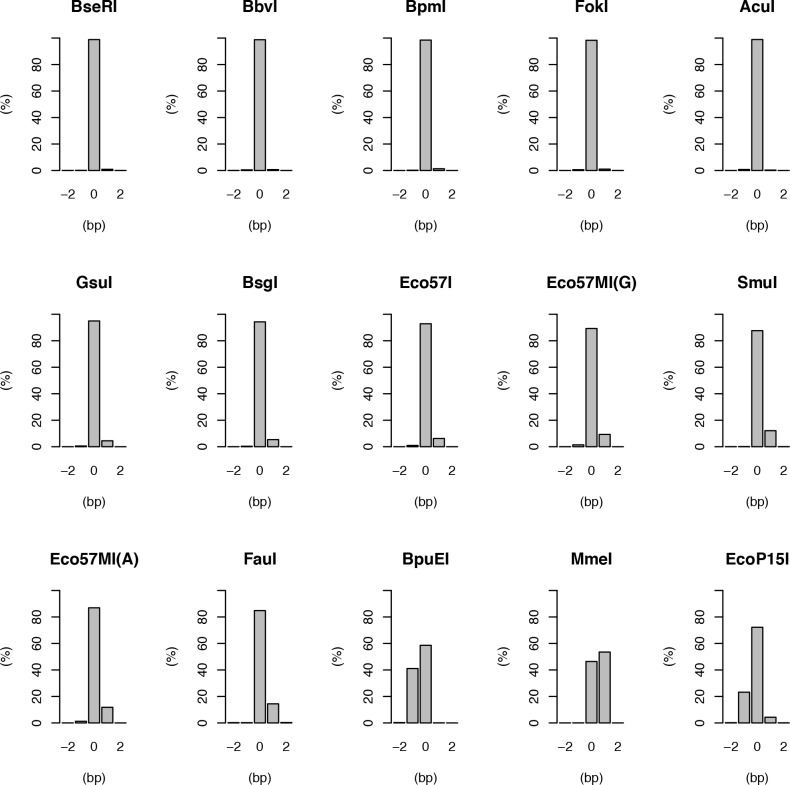
Figure 2. Slippage distributions for the Type IIS enzymes tested.
Bar plots showing the percentage of reads obtained at the expected distance (0) and +/− 2 bp away for different Type IIS enzymes. The enzymes display a wide range of length specificity but usually not more than 1 bp away from the preferred distance.

