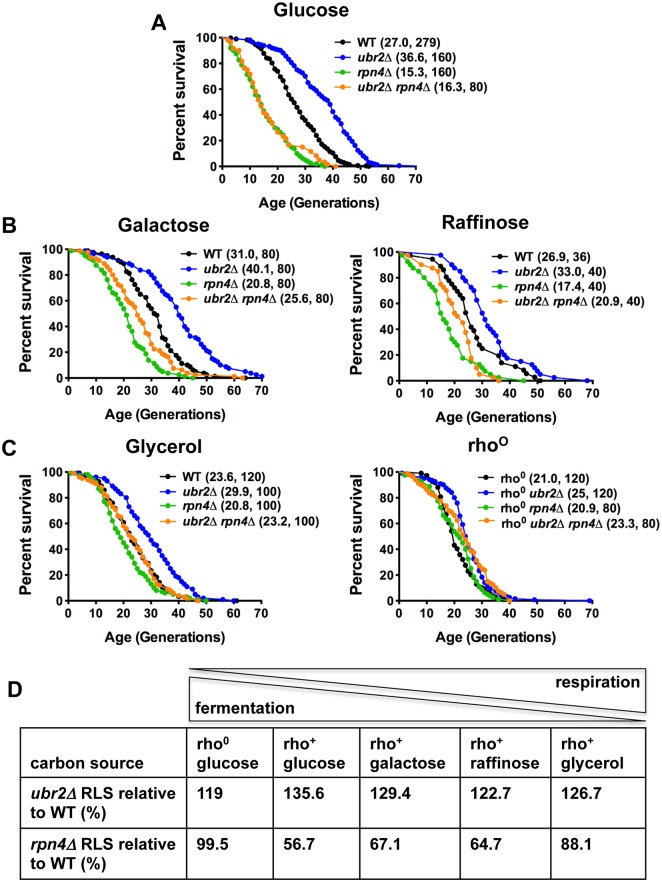
Figure 1. Proteasome-mediated impact on RLS is attenuated in response to the carbon source.
(A) Longevity correlates with proteasome abundance. Survival curves of cells with increased (ubr2Δ) or reduced proteasome capacity (rpn4Δ or rpn4Δ ubr2Δ) grown in glucose media at 30°C. (B) Proteasome-mediated lifespan extension varies with the carbon-source. Survival curves of the strains used in (A) grown on media with galactose or raffinose as carbon source. (C) The impact of varying proteasome levels are largely abrogated on the non-fermentable carbon source glycerol (left panel) or in cells devoid of functional mitochondria (rho0, right panel). Mean lifespan and cell counts are shown in parenthesis. A statistical analysis of the data is summarized in S3 Table. (D) Relative lifespan extension or shortening in proteasome mutants in response to different carbon sources. The ratio between respiration and fermentation induced by the different carbon sources is indicated on top.

