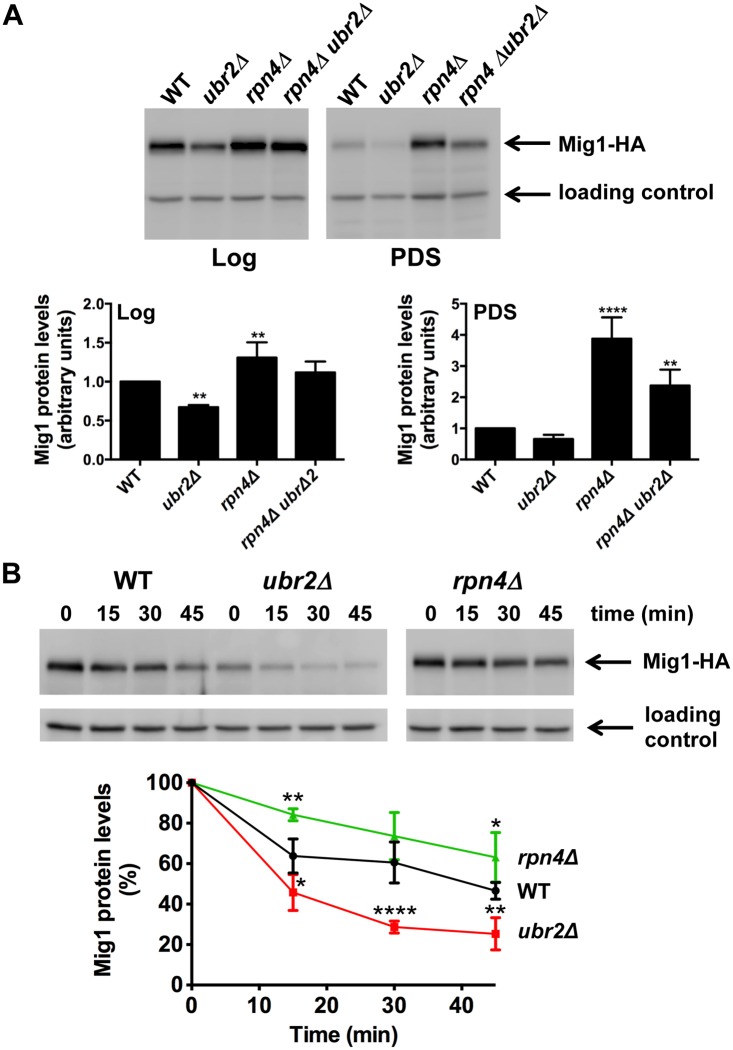
Figure 5. Proteasomes determine the abundance of the Snf1-regulated transcription factor Mig1.
(A) Mig1 abundance correlates with proteasome capacity. Mig1 protein levels in normalized lysates were investigated via a C-terminal HA tag in cells with increased (ubr2Δ) or decreased (rpn4Δ, rpn4Δ ubr2Δ) proteasome activity under fermentative (log) or oxidative growth conditions (PDS). Detection of PGK1 was used as a loading control. The chemiluminescence signals of the immunoblot analysis were recorded in an Image Quant detection instrument (upper panels) and quantified using the Image Quant software (lower panels). The mean +- SD of four independent experiments is presented. P-values represent the statistical significance relative to WT expression and were assessed by an Ordinary one-way Annova using the GraphPad Prism software. P-values: * p < 0.05, ** p < 0.01, *** p < 0.001. (B) Mig1 is a proteasome target. The turnover of Mig1 on cells grown in galactose was determined in WT, rpn4Δ, and ubr2Δ cells after new synthesis was blocked with 200 μg/ml CHX. Mig1 levels were detected and quantified as in (A).

