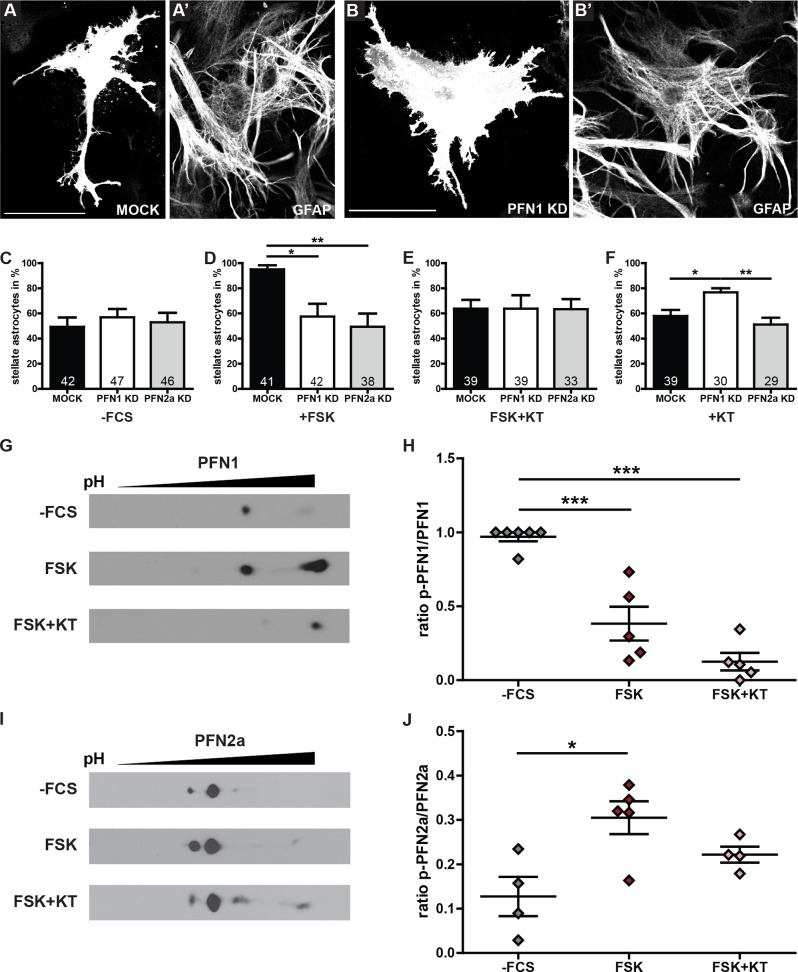
Fig 4. PKA-dependent stellation induces changes in phosphorylation of both profilins.
(A) MOCK transfected astrocyte attains a stellate phenotype upon stimulation with 10 μM forskolin (FSK) for 2 hours. (B) Astrocyte expressing a shRNA specific for PFN1 treated with forskolin. The fluorochrome expressing cell does not contract properly. (C, D, E, F) Astrocytes transfected with either MOCK, PFN1 KD or PFN2a KD were categorized into stellate and polygonal cells. (C) 4 hours serum starved astrocytes showed no alterations comparing the 3 different groups (MOCK 49.3±7.4%; PFN1 KD 56.9±6.6%; PFN2a KD 52.9±7.6%) and served as control condition. (D) MOCK transfected astrocytes are significantly more stellate upon forskolin treatment (95.0±3.3%) compared to both PFN1 KD (57.5±10.1%) or PFN2a KD cells (49.4±10.5%). (E) Simultaneous co-application of FSK and the PKA inhibitor KT5720 (KT, 100 nM) abolished the stellation effect of FSK on MOCK transfected cells (MOCK 63.8±7.0%; PFN1 KD 63.8±10.7%; PFN2a KD 63.3±8.0%). (F) Upon PKA inhibition by KT5720 treatment, the downregulation of PFN1 (76.7±3.3%) leads to a significant increase in stellate astrocytes relative to MOCK (57.9±4.8%) or PFN2a knockdown (51.2±5.4%). (G) 2D gel electrophoresis with subsequent Western Blot analysis of PFN1. Astrocytic cultures were kept in DMEM without supplement (-FCS), treated with 10 μM forskolin for 2 hours (FSK) or treated with 10 μM forskolin for 2 hours in the presence of 100 nM KT5720 (FSK+KT). (H) Quantification of the phosphorylation status of PFN1. Dot intensities were measured with Image J. Intensity values of all dots were totaled and the intensity of the left dot was divided through the total intensity. The mean relative amount of phosphorylated PFN1 was significantly decreased in forskolin treated cultures (0.38±0.11) compared to control cultures (0.97±0.03). Cultures treated with both FSK and KT attained a fraction of 0.13±0.06, which is significant to the control group but not to FSK treated cultures. (I) 2D gel electrophoresis with subsequent Western Blot analysis of PFN2a. Cultures were treated as indicated in G. (J) Quantification of the phosphorylation status for PFN2a as described in H. The mean relative amount of phosphorylated PFN2a was significantly increased in forskolin treated cultures (0.31±0.04) compared to control cultures (0.13±0.04). Cultures treated with both FSK and KT attained a fraction of 0.22±0.02, which is a non-significant decrease (p = 0.11) compared to forskolin treated cultures. Quantitative data obtained from 3 (F, H) or 4 (C-E, J) independent experiments was tested for significance by one-way ANOVA followed by a post-hoc Tukey’s Multiple Comparison Test. Significance is indicated as follows *p<0.05; **p<0.01; ***p<0.001. Data are shown as mean ± SEM.

