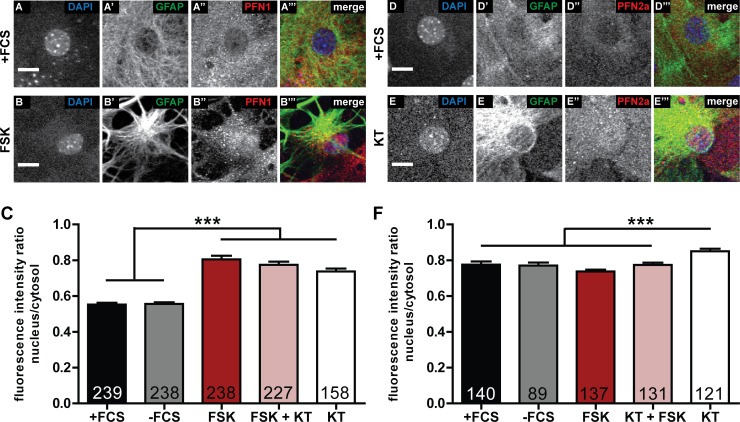
Fig 5. Subcellular localization of profilin isoforms is altered by forskolin treatment and PKA inhibition.
(A) Control cell (+FCS) and (B) a forskolin treated cell (FSK). In addition to the morphological change, the amount of PFN1 in the nucleus of the cell treated with forskolin was increased. (C) Quantification of the PFN1 ratio between cytosol and nucleus. Treatment with either forskolin or KT5720 or both leads to an increased amount of PFN1 in the nucleoplasma of astrocytes. (D) Control cell (+FCS) and (E) a KT5720 treated cell (KT). The amount of PFN2a in the nucleus of the astrocyte is increased in comparison to control upon KT5720 treatment. (F) Quantification of the PFN2a ratio between cytosol and nucleus. Solely treatment with KT5720 increases the amount of PFN2a in the nucleoplasma. Quantitative data obtained from 3 (KT treatment) or 4 independent experiments was tested for significance by one-way ANOVA followed by a post-hoc Tukey’s Multiple Comparison Test. Significance is indicated as follows *p<0.05; **p<0.01; ***p<0.001. Data are shown as mean ± SEM.

