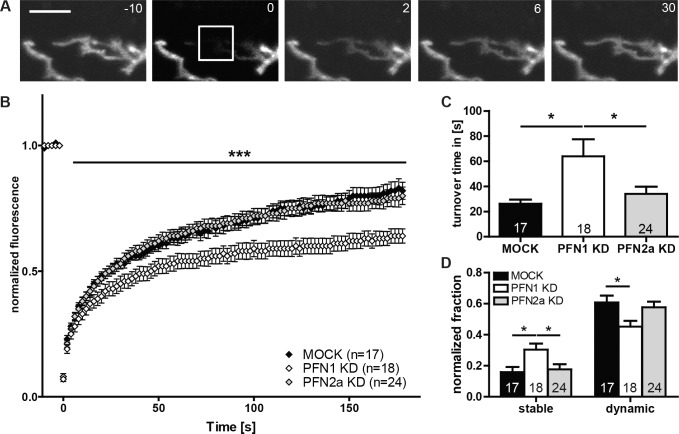
Fig 7. FRAP analysis reveals PFN1 as major regulator of actin dynamics in astrocytic processes.
(A) Astrocytes co-expressing eGFP-actin and siFluc, shPFN1 or shPFN2a, respectively, were used for FRAP analysis to determine the effect of profilins on actin dynamics in PAPs. eGFP-actin fluorescence was bleached from a square of 4x4 μm (white rectangle) containing one or two small astrocytic processes and fluorescence recovery was monitored for 180 s. Scale bar: 5 μm. (B) Recovery curve for control, as well as PFN1 and PFN2a knockdown astrocytes. Solely intensity values of cells with a reduced level of PFN1 are significantly lower compared to control. (C) Turnover time is accordingly increased for cells with decreased amounts of PFN1 (63.89±13.61 s) compared to MOCK (26.24±3.3 s) and PFN2a KD (34.08±5.7 s). (D) Analysis of the actin pools reveals, solely for PFN1 knockdown cells, a decrease in the dynamic and a corresponding increase in the stable pool. Quantitative data obtained from 4 independent experiments was tested for significance by either one-way ANOVA followed by a post-hoc Tukey’s multiple comparison test or two-way ANOVA (B). Significance is indicated as follows *p<0.05; **p<0.01; ***p<0.001. Data are shown as mean ± SEM.

