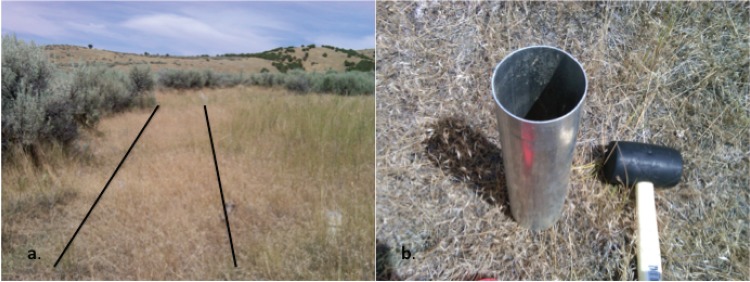
Figure 1. Shrub removal plot (a.) from which cheatgrass dominated soils (b.) were sampled and the adjacent area from which sagebrush-dominated soils were sampled.
The black lines in panel a. outline the cheatgrass-dominated soils that were sampled in the 1 m × 20 m border of the plot; cheatgrass-dominated soils outlined in panel a. are shown up-close in panel b. Photos were taken by C.F. Weber at the time of sampling (September 2011).

