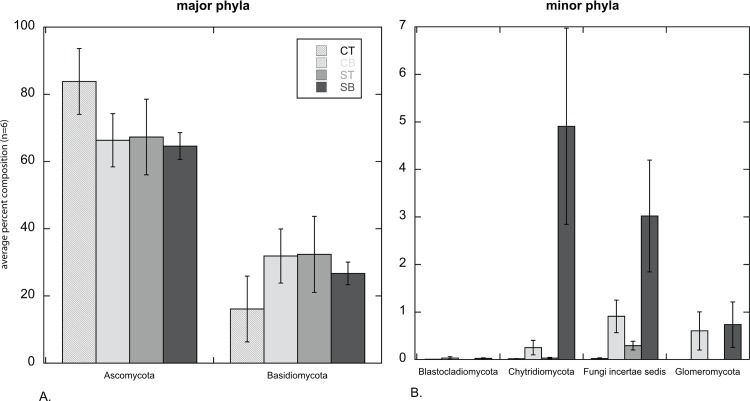
Figure 2. The average percentage of sequences for each soil interval that classified within a particular fungal phylum (n = 6 ± 1 standard error).
Soil intervals are designated as CT (cheatgrass 0–4 cm), CB (cheatgrass 4–8 cm), ST (sagebrush 0–4 cm) and SB (sagebrush 4–8 cm). Where bars are absent, the phylum was absent from all replicates.

