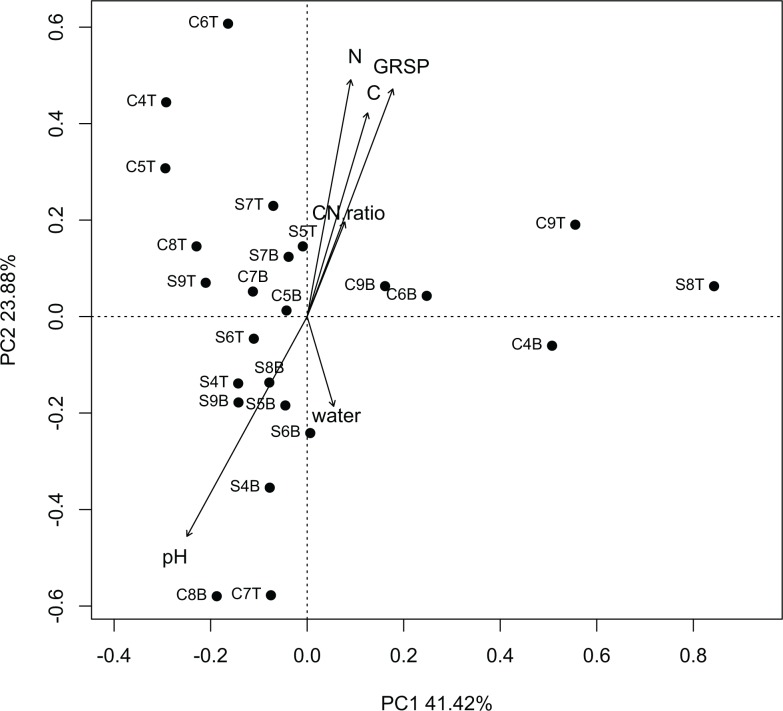
Figure 3. Multidimensional scaling plot (Bray-Curtis dissimilarity metric) displaying the relatedness of sequence library composition based on order-level classification.
Soil intervals and sequence libraries from them are designated as CT (cheatgrass 0–4 cm), CB (cheatgrass 4–8 cm), ST (sagebrush 0–4 cm) and SB (sagebrush 4–8 cm). Each sequence library is accompanied with a sample number (4, 5, 6, 7, 8 or 9). Arrows represent projections of soil variables (water content (water), glomalin related soil protein (GRSP), % carbon (C), % nitrogen (N), C:N ratio and pH) relative to community composition.

