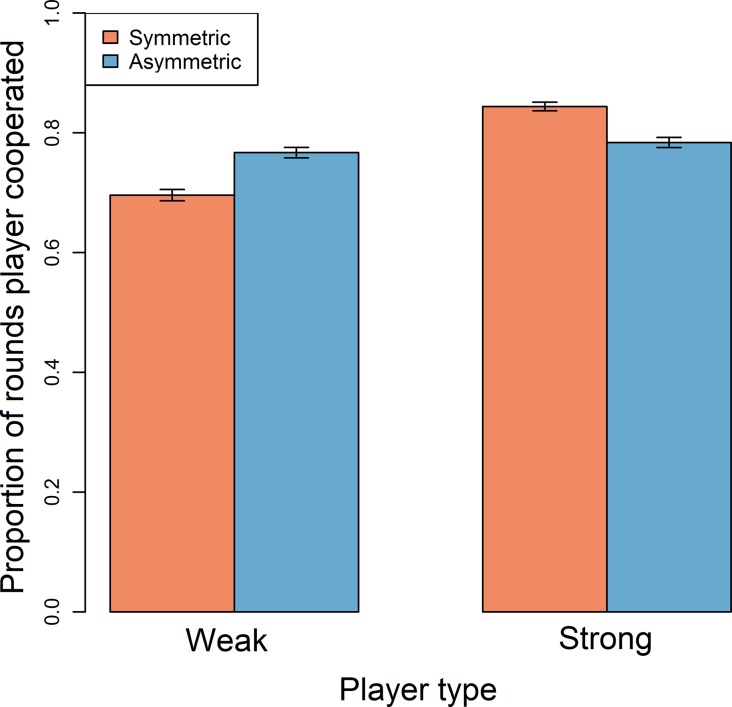
Fig 1. Barplot showing the proportion of rounds which players cooperated in symmetric (red bars) and asymmetric (blue bars) games according to whether they were weak or strong.
Data exclude rounds where either player opted out or was bankrupt. Error bars represent standard errors. Plots are generated from raw data.

