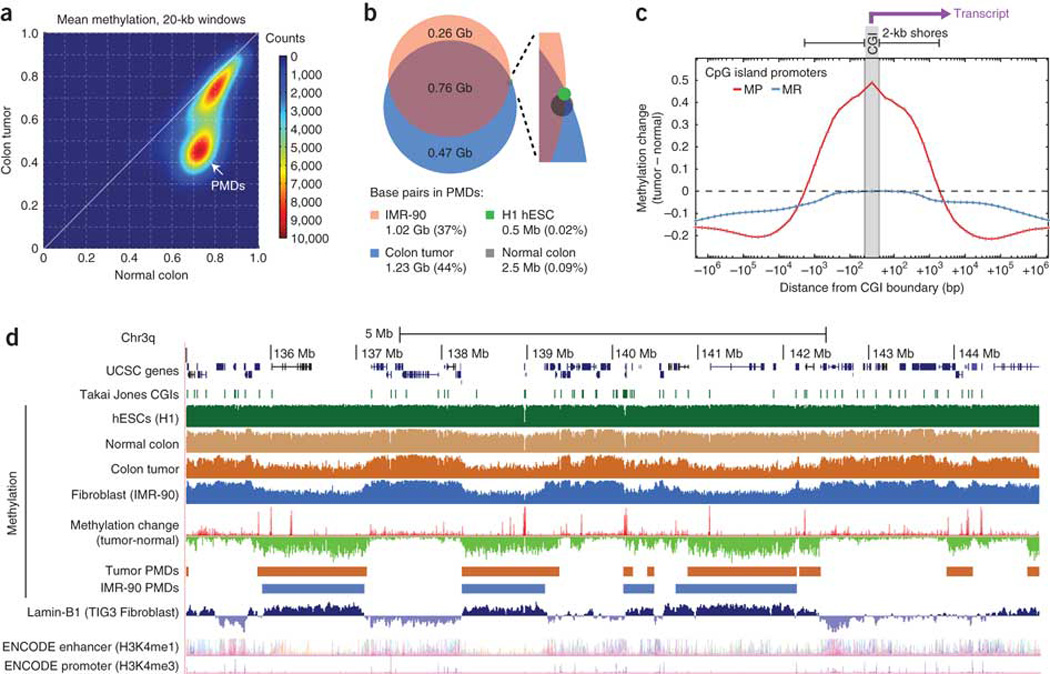
Figure 4. Hypermethylated CGIs fall within long, tumor-specific PMDs.

(a) Density plot of average DNA methylation within all 20-kb windows on chromosome 4 showing a distinct subset of windows representing PMDs in the tumor but not normal colon tissue. (b) We identified PMDs for four cell types by searching for 100-kb partially methylated windows (see text), and we compared the percentage of the genome contained within PMDs between the tumor and normal colon tissue along with two other cell types7. (c) The average methylation change is shown as a function of distance from CGI promoters for all promoters that were unmethylated in the normal colon (with mean methylation <0.2). We divided promoters into methylation-prone (MP; with mean tumor methylation >0.3) and methylation-resistant (MR; with mean tumor methylation <0.2), and the plots are oriented to show the transcribed region toward the right side. (d) UCSC Genome Browser plot of a representative 10-Mb region on chromosome 3q showing substantial overlap between colon tumor and IMR-90 PMDs, Lamin-B1 marks and focal hypermethylation (methylation-resistant elements are visible as red spikes in the methylation change track). Lamin-B1 and ENCODE enhancer and promoter tracks are from the UCSC annotation database.
