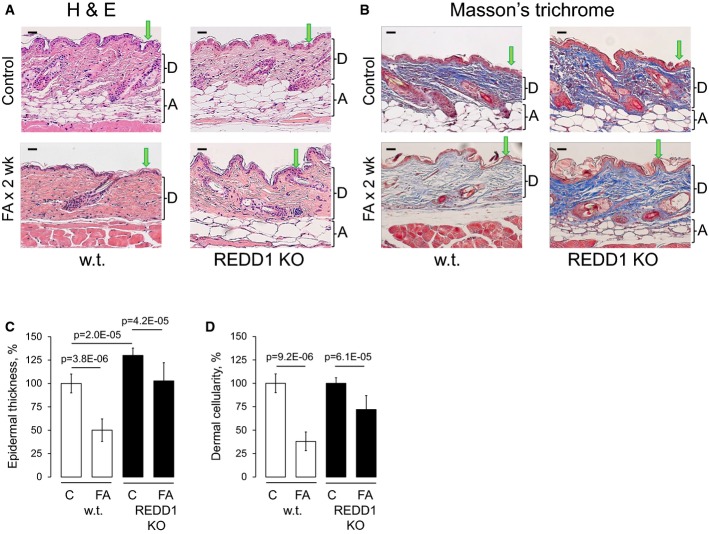
Figure 3. REDD1 KO mice are resistant to glucocorticoid-induced skin atrophy.
- A, B H&E staining (A) and Masson's trichrome staining: Dermis/collagen fibers are blue, muscle is red, nuclei are dark red, and cytoplasm is red/pink (B). Arrows point to epidermis and brackets indicate subcutaneous adipose (A) and dermis (D). Scale bars are 20 μm.
- C, D Morphometric analysis of epidermal thickness and dermal cellularity as described in Materials and Methods. Changes in epidermal thickness (C) are presented as % to wild-type control epidermis. Changes in dermal cellularity (D) are presented as % to corresponding control skin. The means ± SD were calculated for three individual skin samples in one representative experiment (30 measurements/condition) out of two experiments. Statistical analysis for differences between treatment and control and between control wild-type and REDD1 KO epidermal thickness was done by the unpaired two-tailed t-test.

