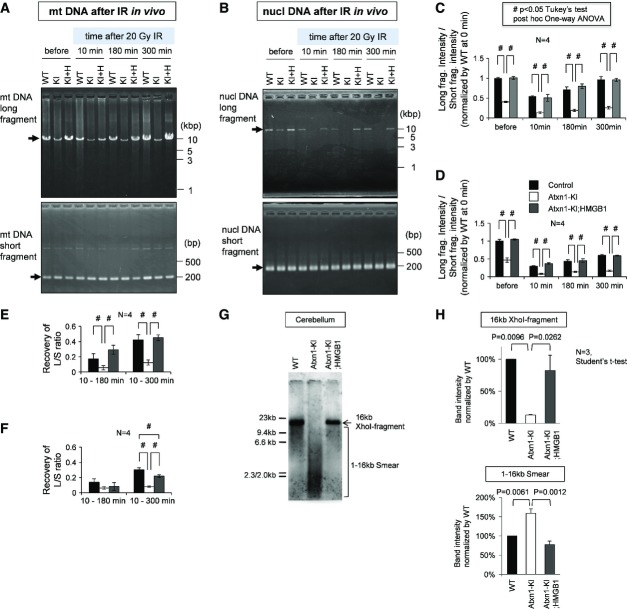
Figure 7. In vivo repair of mitochondrial DNA damage by HMGB1.
Mitochondrial DNA damage repair was evaluated in vivo in mice subjected to X-ray irradiation (20 Gy) under anaesthesia. Cerebellar tissues were collected 10, 180 and 300 min after irradiation.
- The mitochondrial DNA amplification assay in the cerebellar tissue obtained from wild-type (WT), Atxn1-KI (KI) and Atxn1-KI;HMGB1-Tg double-transgenic (KI+H) mice. Amplification of the long and short fragments from the mitochondrial genome was performed at each time point after irradiation.
- Quantitative analysis of mitochondrial DNA damage at each time point using the ratio between short and long PCR fragments (long/short). Reduction of the ratio indicates enhanced DNA damage. The data are presented as mean ± SD. #P < 0.05 in one-way ANOVA followed by post hoc Tukey's test.
- Reversal of mitochondrial DNA damage from 10 min to 180 min or 300 min was evaluated by subtraction of the values. The data are presented as mean ± SD. #P < 0.05 in one-way ANOVA followed by post hoc Tukey's test.
- The nuclear DNA amplification assay in the cerebellar tissue obtained from wild-type (WT), Atxn1-KI (KI) and Atxn1-KI;HMGB1-Tg double-transgenic (KI+H) mice. Amplification of the long and short fragments from the nuclear genome was performed at each time point after the irradiation; #P < 0.05 in one-way ANOVA followed by post hoc Tukey's test.
- Quantitative analysis of nuclear DNA damage at each time point using the ratio between short and long PCR fragments (long/short). A reduction in the ratio indicates enhanced DNA damage. The data are presented as mean ± SD. #P < 0.05 in one-way ANOVA followed by post hoc Tukey's test.
- Reversal of nuclear DNA damage from 10 to 180 min or 300 min was evaluated by subtraction of the values. The data are presented as mean ± SD. #P < 0.05 in one-way ANOVA followed by post hoc Tukey's test.
- Southern blot analysis of mitochondrial genomic DNA prepared from wild-type (WT), Atxn1-KI or Atxn1-KI;HMGB1-Tg double-transgenic mice. Mitochondrial DNA copy numbers were largely similar among the genotypes, although quality of the mitochondrial DNA was remarkably different.
- Signal intensity of a 16-kb band corresponding to the intact mitochondrial genome and those of a DNA smear (< 16 kb) corresponding to a degraded mitochondrial genome were quantified using ImageQuant LAS500 (GE Healthcare Life Sciences, Little Chalfont, UK) with ImageQuant TL software.
Source data are available online for this figure.

