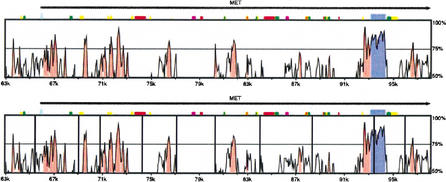
Figure 4.
Cat versus mouse: A VISTA picture showing an AVID alignment of the 5′ region of the MET gene in cat and mouse. The top panel shows the alignment of the two finished sequences with the X-axis showing coordinates in the mouse, and the Y-axis showing the %identity in a 100-bp window. The bottom panel shows the results of a draft placement simulation: the cat sequence has been sliced at locations corresponding to the vertical black lines. The resulting contigs were permuted (order and orientation changed randomly) and realigned to the mouse.

