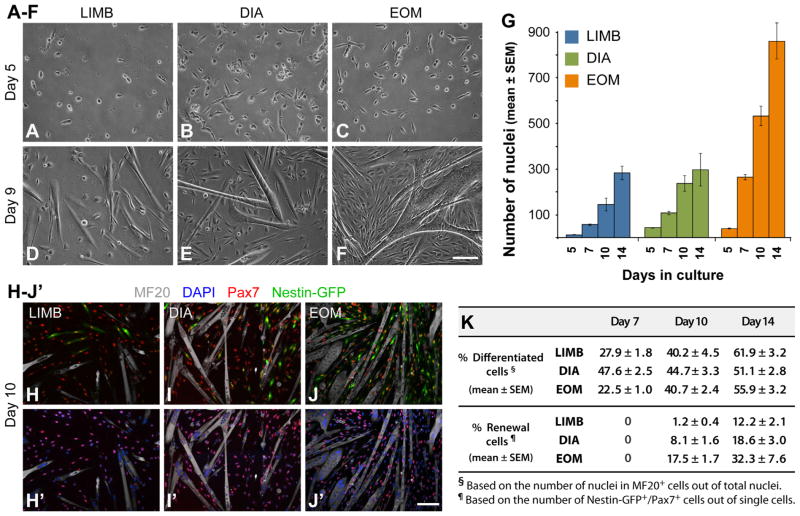
Fig. 2.
Growth analysis of LIMB, DIA and EOM SC primary cultures. SCs were isolated from adult Nestin-GFP mice as described in Figs. 1B and S3A and plated at 1000 cells per well in 24-well plates. (A–F) Representative phase images of day 5 and day 9 cultures. (G) The number of total nuclei per microscopic field (20 × objective) was counted based on DAPI staining of cultures fixed on days 5, 7, 10 and 14. Data are expressed as mean ± SEM. Per each culture day, one-way ANOVA analysis reveals a statistical difference (p<0.01) between the three muscle groups, except for DIA vs. EOM cultures on day 5 (p=0.36), and LIMB vs. DIA cultures on day 10 (p=0.05) and on day 14 (p=0.86). (H–J′) Representative fluorescent images of day 10 LIMB, DIA and EOM cultures double-immunostained for Pax7 and sarcomeric myosin (MF20), demonstrating the presence of Pax7+/Nestin-GFP+ renewal cells. (K) Quantification of differentiated and renewal cells on days 7, 10 and 14 of LIMB, DIA and EOM cultures immunostained for Pax7 and sarcomeric myosin (MF20). Scale bars, 100 μm (A–F) and (H–J′).

