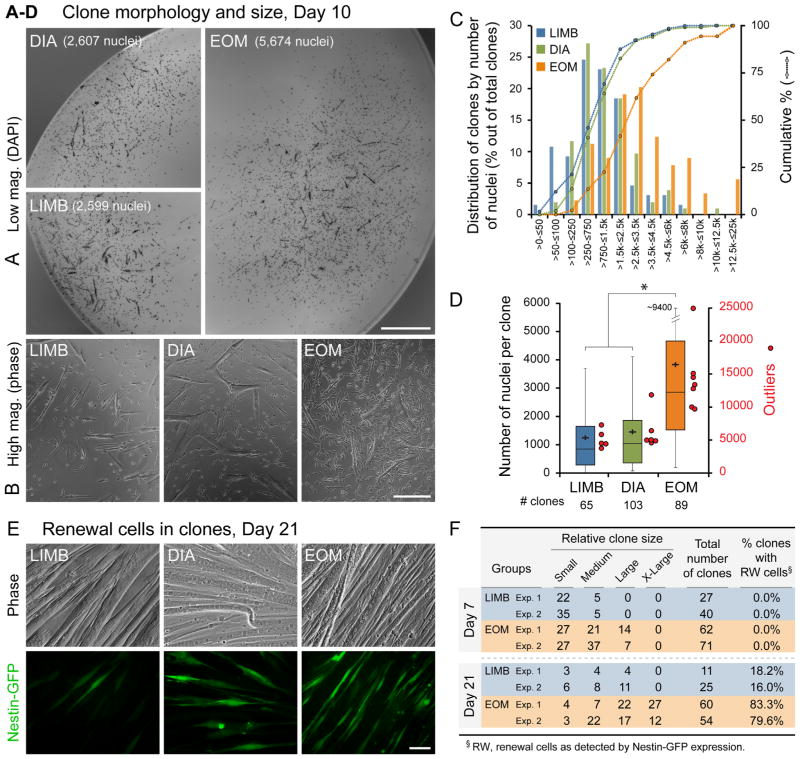
Fig. 3.
Clonal analysis of LIMB, DIA and EOM SCs. SCs were isolated from adult Nestin-GFP mice as described in Figs. 1B and S3A. (A–D) Clonal cultures were fixed on day 10 and stained with DAPI for quantifying clone size according to the number of nuclei. (A and B) Examples of (A) low-magnification whole clone images (DAPI stained), and (B) high-magnification phase images demonstrating the typical morphology and cell density of average size LIMB, DIA and EOM clones. (C) Distribution of LIMB, DIA and EOM clones according to the number of nuclei per clone. Clones are clustered in bins in ascending order according to the number of nuclei per clone (x-axis) vs. the percentage of clones in each bin out of total clones analyzed (histograms, left y-axis). In the cumulative curves, each data point (round-shaped, right y-axis) shows the percentage of clones out of total clones analyzed that contain less than, or equal to (≤) the corresponding number of nuclei per clone size range indicated on the x-axis bins. (D) Clonal data analyzed in (C) are also illustrated as boxplots, depicting the quartile distribution, mean (black crosses) and outliers (red circles, right y-axis) for the number of nuclei per clone; whisker ranges and outliers were calculated as previously detailed by us in (Shefer et al., 2013). Asterisk denotes statistically significant difference in clone size between EOM vs. LIMB and DIA clones (p<0.01). (E) Representative phase and fluorescence images of day 21 clones established from LIMB, DIA and EOM SCs showing Nestin-GFP+ renewal cells with a typical higher manifestation in EOM clones. (F) Quantification of SC clones that harbor Nestin-GFP+ cells demonstrates that renewal cells are consistently more frequent in EOM clones. The relative clone size was also estimated by categorizing each clone as small, medium, large or X-large depending on whether the clone occupied a 20×, 10 ×, 4 × or several 4 × objective fields, respectively. On day 7, only EOM cultures displayed clones in the “Large” category. Then, by day 21, solely EOM harbored “X-Large” clones, while clones falling in the two smaller categories represented only 30% of total clones for EOM vs. 60% for LIMB cultures. Scale bars, 1 mm (A), 250 μm (B), 50 μm (E).

