Fig. 6.
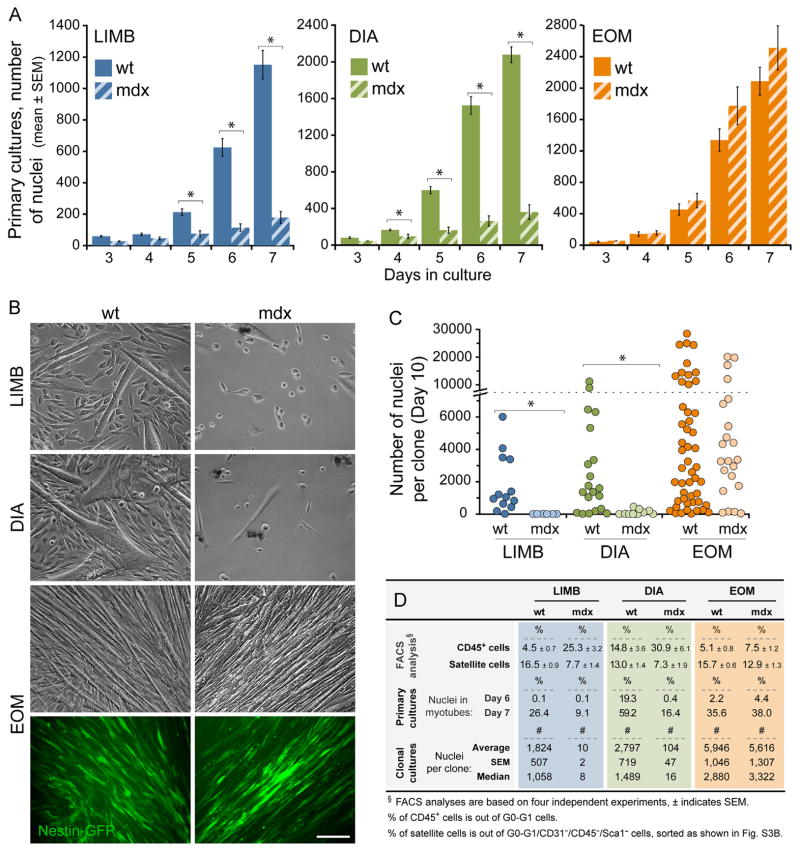
EOM SCs from dystrophin-null mdx4cv mice retain performance superiority. LIMB, DIA and EOM SCs were isolated from Nestin-GFP (wt) and mdx4cv/Nestin-GFP (mdx) 6 month old mice by flow cytometry according to Nestin-GFP expression combined with an antigen-based sorting approach (Fig. S3B), which permitted assaying the level of CD45+ cells as a reference for the inflammatory process associated with dystrophinopathy. (A) For each muscle group, the number of total nuclei was counted based on DAPI staining of cultures fixed on days 3–7. Data are expressed as mean (±SEM) number of nuclei per 10 microscopic fields (20 × objective) and not per single field as in Fig. 2G due to the low number of cells in mdx LIMB and DIA cultures. Within each muscle group, asterisks denote statistically significant differences (p<0.03, one-way ANOVA) for wt vs. mdx cultures per each culture day; notably, there are no statistical differences between EOM wt vs. mdx at any of the culture days. (B) Representative images of day 14 cultures of LIMB, DIA and EOM depict the meager growth of mdx cultures from LIMB and DIA SCs, while also highlighting the outperformance of EOM SCs within the wt groups. Among the mdx cultures, only those from EOM developed Nestin-GFP+ renewal cells. Scale bar, 100 μm. (C) Clonal cultures of LIMB, DIA and EOM SCs isolated from wt and mdx mice were quantified on day 10 in the same manner as in Fig. 3A–D. Clones are plotted individually based on total number of DAPI+ nuclei per clone. One-way ANOVA analysis reveals a statistical difference (p<0.03, asterisks) between wt and mdx clones within LIMB and DIA, but not within EOM (p=0.13). A statistical difference (p<0.03) was also noted between EOM clones vs. LIMB and DIA regardless of mdx or wt origin. (D) Summary of additional relevant data from the analysis of the sort profiles, and the primary and clonal cultures. The percentage of CD45+ cells was determined by using a distinctive fluorochrome (PE-Cy7 for anti-CD45 vs. APC for anti-CD31 and anti-Sca1) when gating out the CD31+, CD45+, and Sca1+ cells. For all panels, asterisks denote statistically significant differences (p<0.03).

