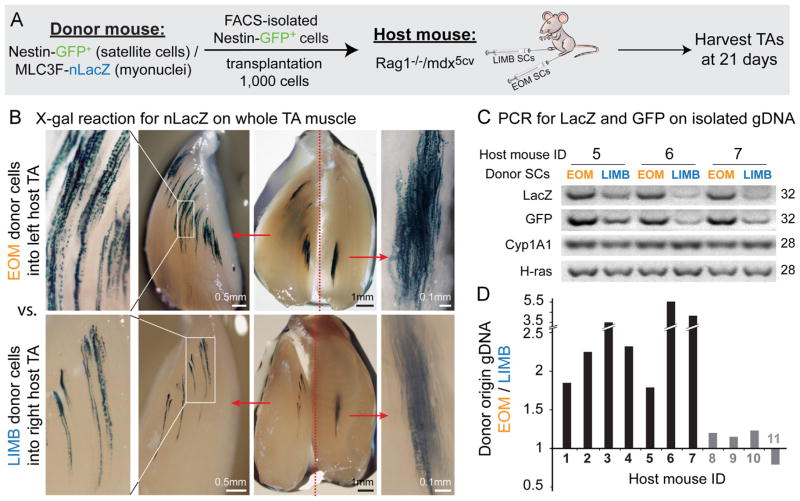
Fig. 7.
X-gal staining and PCR analysis demonstrating higher engraftment efficiency of EOM vs. LIMB SCs following intra-muscular transplantation into the TA muscles of host Rag1−/−/mdx5cv mice. (A) EOM and LIMB SCs were isolated from double transgenic Nestin-GFP/MLC3F-nLacZ mice (4–5 month old, 3 donors per experiment) as described in Figs. 1B and S3A and injected into the TAs of Rag1−/−/mdx5cv host mice (8–9 week old, 3–4 hosts per experiment). For each host animal, the TA from one leg was injected with EOM donor SCs, while the TA from the contralateral leg was injected with LIMB donor SCs. The level of donor-derived contribution in host muscles was then determined 3-weeks post transplantation. (B) Images of X-gal stained host TAs from one representative mouse, demonstrating the expression of the MLC3F-nLacZ reporter (from transplanted donor SCs) in myofiber nuclei. TAs were first cut longitudinally into 2 halves before fixation and were further trimmed after X-gal reaction to obtain more in-depth view and better imaging of the sites containing LacZ positive nuclei. Scale bars, for each injected TA from left to right, 0.5 mm, 1 mm and 0.1 mm. (C) Examples of PCR products used to quantify the level of donor-derived genomic material (LacZ and GFP) in comparison to the level of the reference genes contributed by host and donor material (Cyp1A1 and H-ras). (D) Each donor gene product (LacZ and GFP) was first normalized with each of the reference gene products (Cyp1A1 and H-ras), resulting in a total of 4 normalized values (2 per each donor gene). The EOM/LIMB ratio was then calculated for each of these normalized values. Given that within the same mouse these ratios are comparable regardless of the donor or reference gene used, final results are presented per each mouse as the average of these ratios. Black histograms denote mice demonstrating a higher engraftment of EOM SCs (~1.8–5.6 fold over LIMB SCs engraftment), while gray histograms denote mice with no apparent distinctions between EOM and LIMB SC engraftment. For both X-gal staining and PCR analysis, controls with vehicle only injected TAs were found negative for donor-derived signal, ensuring the reliability of detection.

