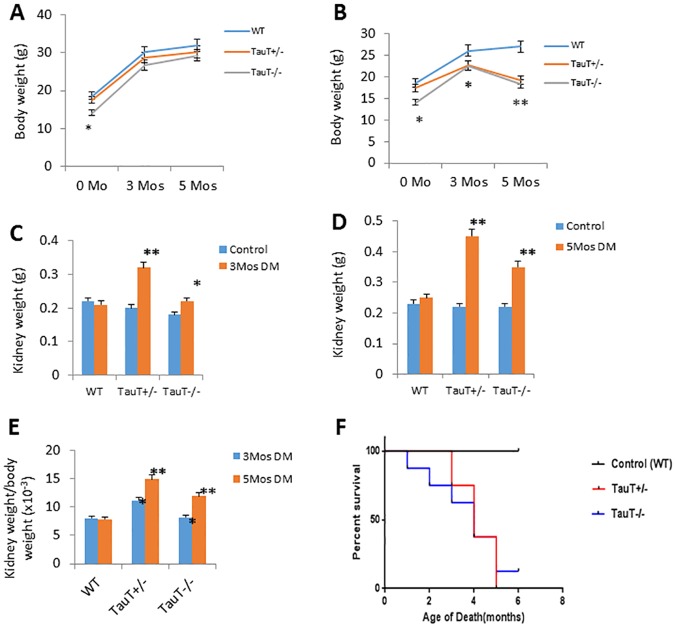
Fig 2. Diabetic TauT-deficient mice showed kidney hypertrophy and decreased survival rate.
A) Body weight changes in each genotype of control mice; B) Body weight changes in each genotype of diabetic mice; C) Kidney weight changes in each genotype of diabetic mice after 3 months and D) 5 months; E) Kidney weight/body weight ratio in each genotype of diabetic mice after 3 or 5 months; F) Kaplan-Meier plot of survival rate of diabetic mice of each genotype. *p < 0.05 vs controls, **p < 0.01 vs controls.

