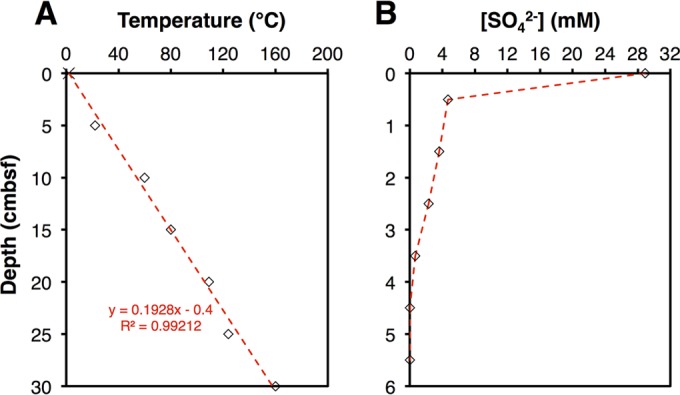
FIG 1.

(A) Measured temperature data for the sediment interval examined by Weber & Jørgensen (5 to 30 cmbsf). The dashed red line indicates the best-fit line, assuming a temperature of 2°C at the sediment surface. The slope of this line was used to model temperatures at higher depth resolution throughout the sediment interval examined in this study. (B) Sulfate concentration profile. Sulfate could not be detected below 4 cmbsf.
