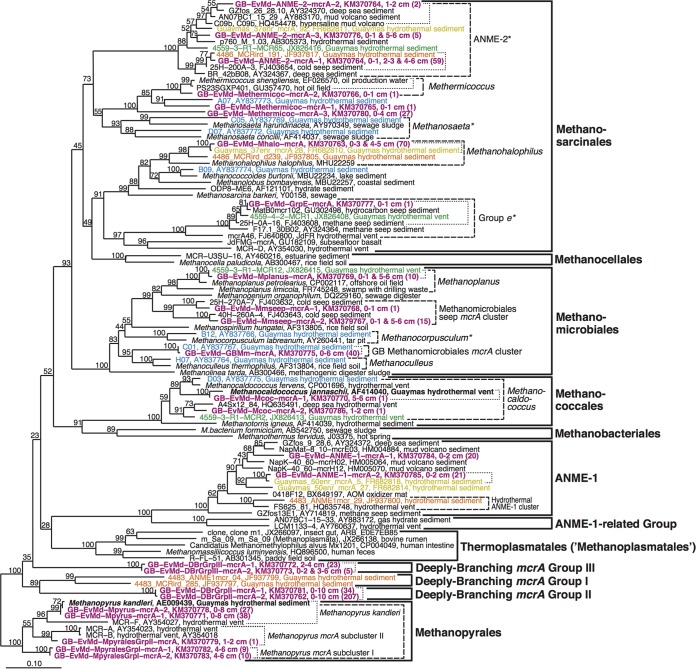
FIG 2.
mcrA gene phylogeny. Representative phylotypes from this study are shown in bold magenta type font. The depth interval of origin is shown, along with the number of clone sequences in parentheses. Phylotypes from other studies on the Guaymas Basin have the following color codes: bold black, pure culture isolates; blue, Dhillon et al. (10); yellow, Holler et al. (11); orange, Biddle et al. (12); green, Y. He and F. Wang, unpublished data. Bootstrap values of ≥50% are shown at branch nodes. Based on sequence similarity calculations, we made the following phylogenetic distinctions: sequences likely to belong to the same species are marked by dotted lines, dashed lines indicate members of the same genus, asterisks (*) indicate genus level mcrA branches that also represent families, and thick solid lines indicate sequences that belong to the same order (for more information on these calculations, see the supplemental material, as well as Discussion).

