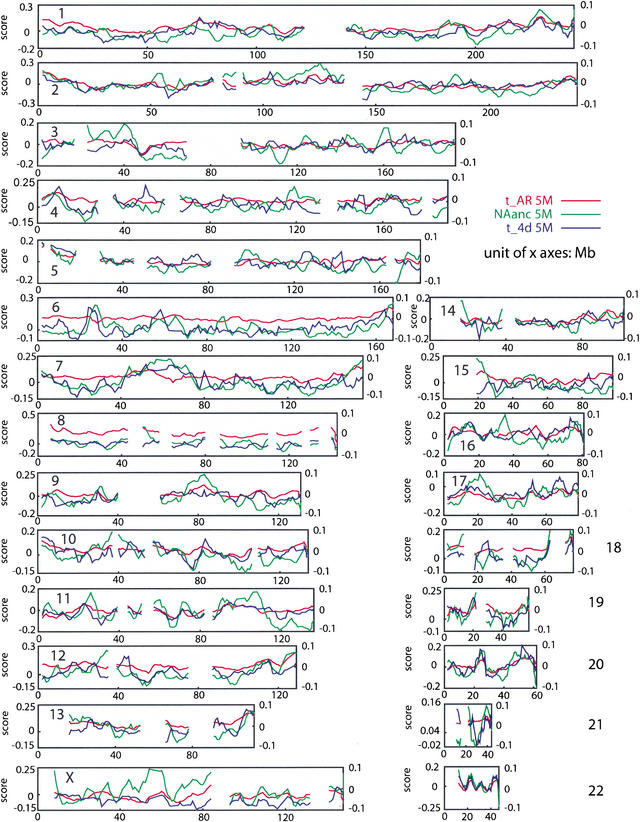
Figure 1.
Variation in neutral substitution rates (tAR and t4D) and fraction not aligning (NAanc, determined largely by deletions) for 22 autosomes and the X-chromosome. Values for these functions in windows of 5 Mb are plotted and shifted by 1 Mb between windows. After removing the quadratic effect of fraction GC for each variable, the residuals of tAR are plotted as the red line (values on right vertical axis), of t4D as the blue line, and of NAanc as the green line (values for residuals of t4D and NAanc on left vertical axis). Only windows with at least 800 4D sites were used in the graphs for tAR and t4D, respectively, leading to the discontinuities in the lines, in addition to sequence gaps.

