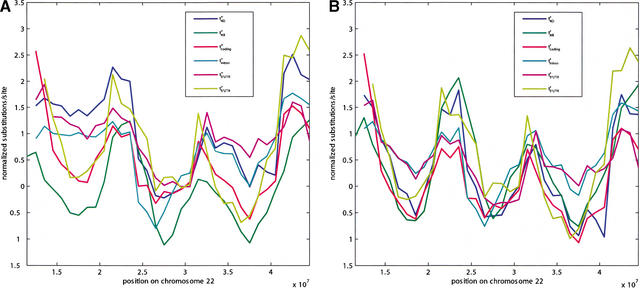
Figure 2.
Variation in t4D, tAR, tintron, tcoding, t3′UTR, and t5′UTR along human Chromosome 22 (A) and residuals of t4D, tAR, tintron, tcoding, t3′UTR, and t5′UTR after quadratic regressions on human CG content along human Chromosome 22 (B). All values were calculated from 5-Mb overlapping by 4-Mb windows of the human–mouse alignment and were normalized using the genome-wide mean and standard deviation (denoted by superscript + in A and * in B). The normalization was done to ensure that all values have the same dynamic range.

