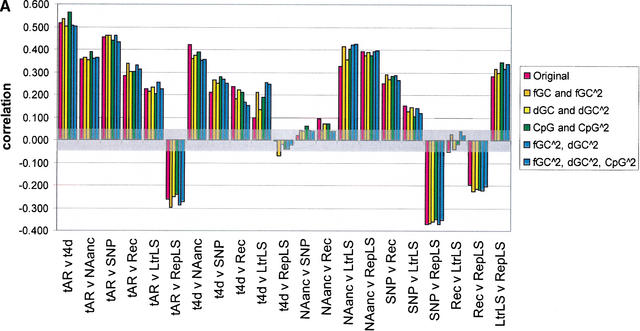
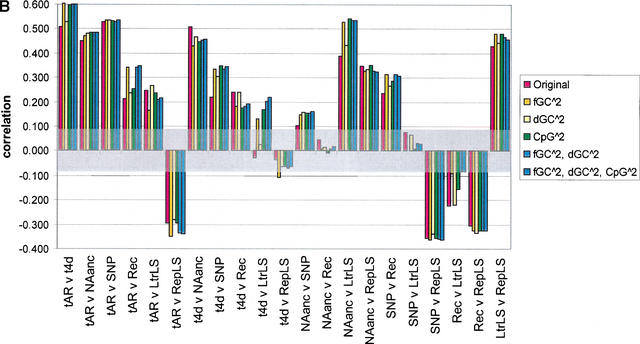
Figure 4.
Pairwise correlations for various divergence measures, before and after correcting for the effect of GC content, difference in GC content between human and mouse, and CpG density in human. The seven divergence measures are neutral substitution rates in ancestral repeats (tAR, noted as tAR in the graph) and 4D sites (t4D, noted as t4d in the graph), deletion proxied by NAanc, SNP density, recombination rate (Rec), and insertion proxied by density of lineage specific LTR repeats (LtrLS) and density of lineage-specific repeats in general (RepLS). Correlations are plotted as bars for (1) original divergence measures (in red); (2) residuals from quadratic regressions on GC content (the regression terms are a constant intercept, fGC and fGC squared) (in gold, noted in the key as fGC∧2); (3) residuals from quadratic regressions on change in GC content between human and mouse (the regression terms are a constant intercept, dGC and dGC squared) (in yellow, noted in the key as dGC∧2); (4) residuals from quadratic regressions on CpG density (the regression terms are a constant intercept, CpG density and CpG density squared) (in green, noted in the key as CpG∧2); (5) residuals from quadratic regressions on GC content and difference in GC content between human and mouse (the regression terms are a constant intercept, fGC, fGC squared, dGC, and dGC squared) (in lighter blue, noted in the key as fGC∧2, dGC∧2); and (6) residuals from quadratic regressions on GC content, difference in GC content between human and mouse, and CpG density in humans (in darker blue, noted in the key as fGC∧2, dGC∧2, CpG∧2) (A) The results for 1-Mb nonoverlapping windows; (B) the results for 5-Mb nonoverlapping windows. A transparent gray rectangle encompasses correlations for which the p-values fall above 0.050 (i.e., a correlation that is not significant at the 5% Type-I error level).


