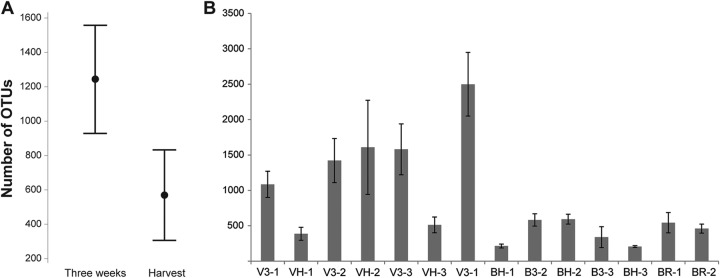
FIG 1.

(A) Mean numbers of OTUs obtained from L. sativa samples collected 3 weeks after planting and at harvest at Farm Buskerud and Farm Vestfold. Also shown are the 95% confidence intervals. (B) OTU abundances on planting samples of L. sativa and D. tenuifolia (BR) from Farm Buskerud (B) and Farm Vestfold (V) at 3 weeks (3) and at harvest (H). Standard-error bars are shown. The number after the hyphen in each designation on the x axis is the planting number.
