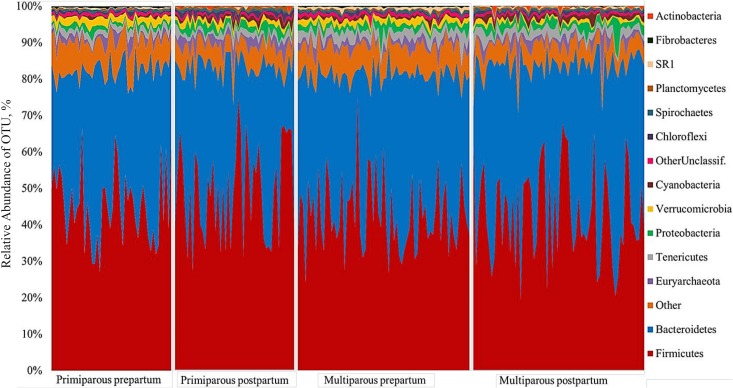
FIG 1.
Aggregate microbiome composition at the phylum level for 16S rRNA sequences according to period relative to calving (prepartum and postpartum) and parity (multiparous and primiparous) for each cow evaluated in the study. The y axis represents the relative abundance of OTUs for all samples evaluated within the specific period relative to calving and parity.

