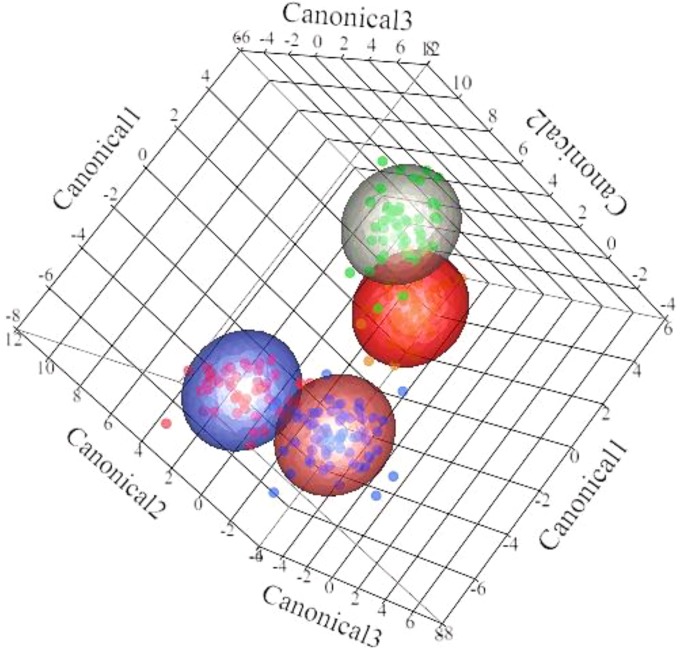
FIG 3.
Discriminant analysis of rumen microbiome samples. Different mean relative abundances in samples were used as covariates and times relative to calving and parity were used as categorical variables. Differences in the ruminal microbial profiles of primiparous (prepartum, red dots; postpartum, green dots) and multiparous (prepartum, blue dots; postpartum, orange dots) are illustrated by canonical 1, 2, and 3.

