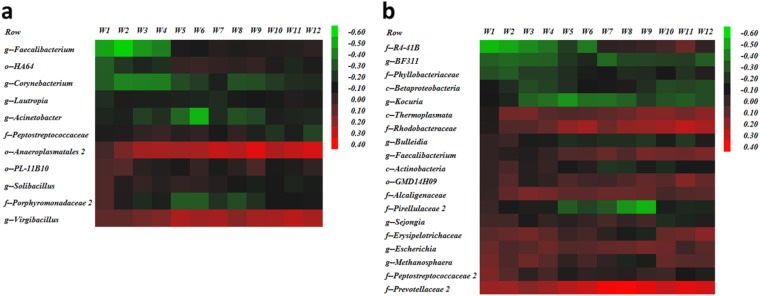
FIG 8.
Heat maps illustrating correlations between bacterial taxa significantly associated with milk production and weekly average of milk production. The color and intensity of each square represent the value of the correlation between bacteria generally significantly associated with milk production and weekly average of milk production. (a) Correlations for the multiparous prepartum cow microbiomes. (b) Correlations for the multiparous postpartum cows microbiomes. The letters before the bacterial names identify the lowest level of classification (k, kingdom; p, phylum; c, class; o, order; f, family; g, genus).

