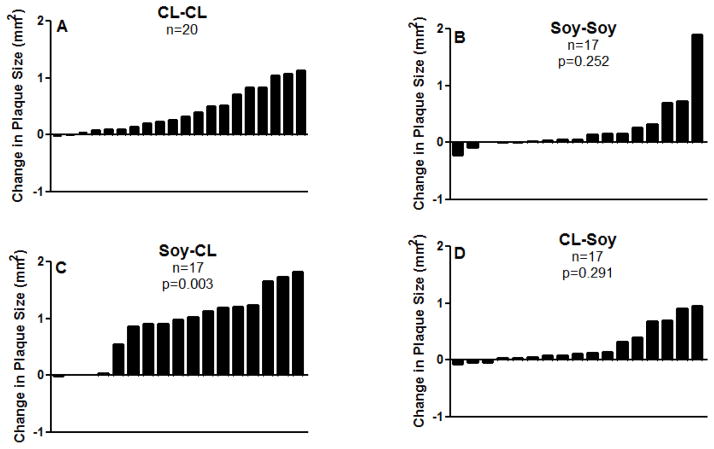
Figure 2.
Change in common iliac plaque size (right common iliac [outcome] – left common iliac [baseline] plaque sizes in mm2) of individual animals in each treatment condition. A) CL-CL (n=20), animals fed CL diet pre and postmenopausally and served as ‘Control group”; B) Soy-Soy (n=17), animals fed Soy diet pre and postmenopausally; C) Soy-CL (n=17), animals fed Soy diet premenopausally and were switched to eat CL diet postmenopausally; D) CL-Soy(n=17), animals fed CL diet premenopausally and were switched to eat Soy diet postmenopausally. Variability is expressed as SEM. p-values compare each condition to the control condition (CL-CL).

