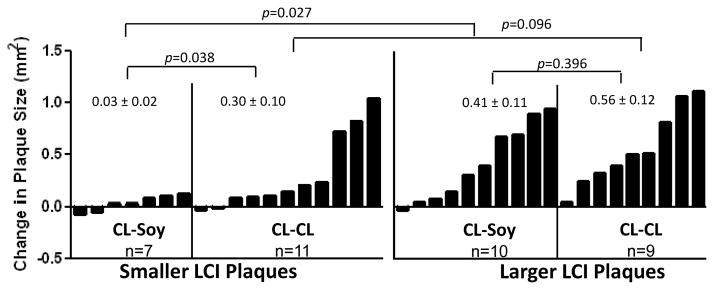
Figure 4.

Subgroup analysis the change of iliac artery atherosclerosis (right common iliac [outcome] – left common iliac [baseline] plaque sizes in mm2). Animals were divided by the median based on pretreatment plaque size (LCI, left common iliac) into smaller or larger plaques and the change in atherosclerotic plaque size among animals fed CL and Soy were compared. Variability is expressed as SEM.
