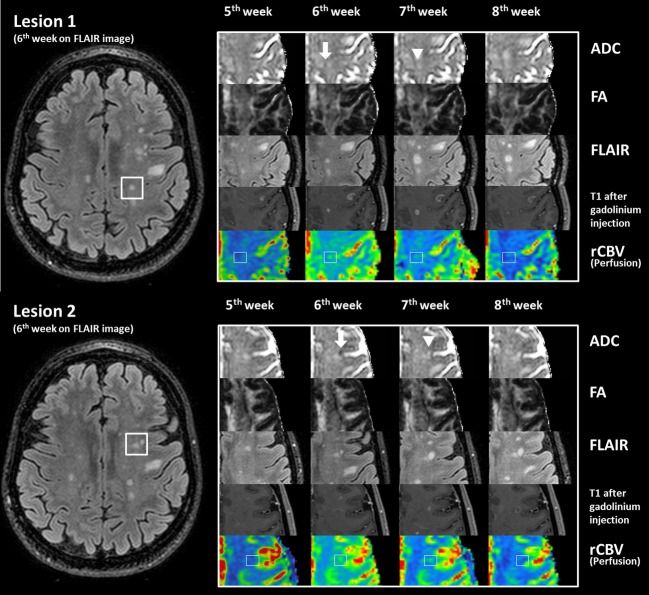
Figure 1.
Weekly evolution of both active lesions using multimodal analysis: images of the active lesions at the last four weeks of the examinations seen on ADC and FA maps, FLAIR, T1 after gadolinium injection and rCBV images. Transient decreased ADC and higher rCBV values arised at the 6th week when lesion appeared with injected T1-weighted image (white arrows). ADC map of the following weeks shows a marked increase (white arrow-head).

