Fig. 5.

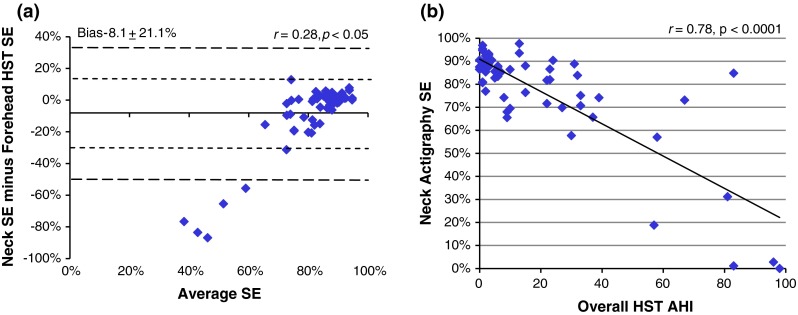
a Bland–Altman plot between sleep efficiency (SE) measured by actigraphy from the neck and forehead HST across all nights, and b correlation plots between HST-AHI and sleep efficiency (SE) by neck actigraphy across all nights

a Bland–Altman plot between sleep efficiency (SE) measured by actigraphy from the neck and forehead HST across all nights, and b correlation plots between HST-AHI and sleep efficiency (SE) by neck actigraphy across all nights