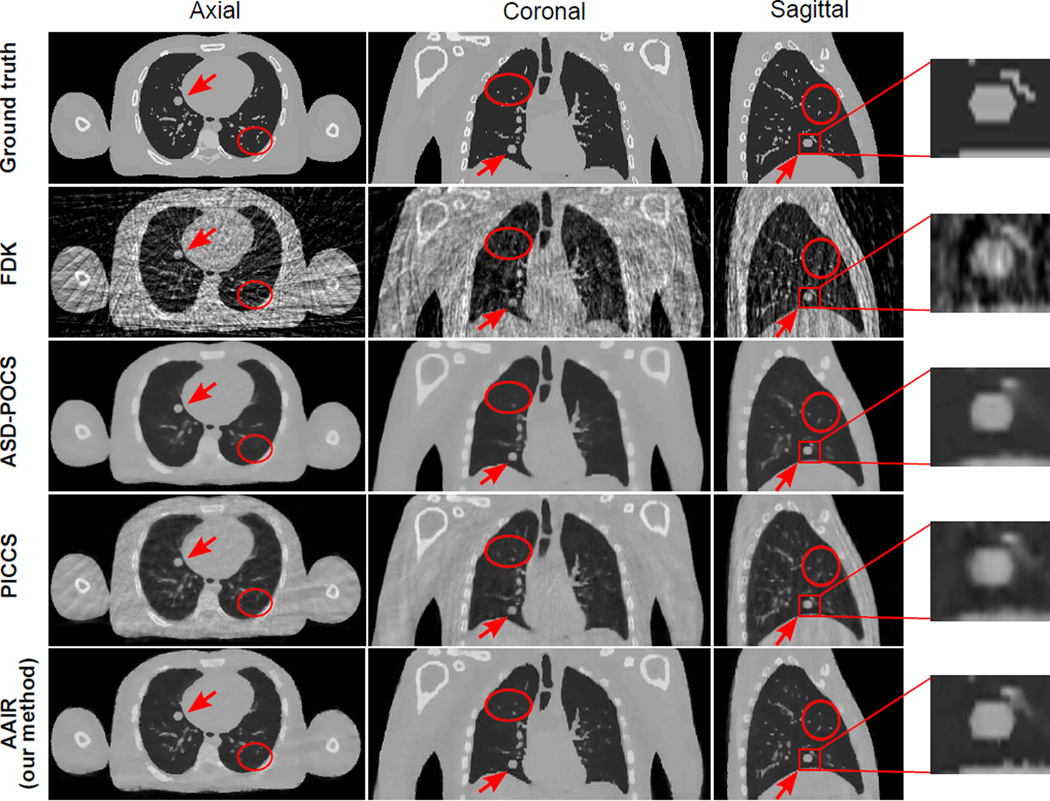
Figure 8.
The ground truth image and the FDK, ASD-POCS, PICCS and AAIR reconstructed images (with 50 half-fan projections) of the digital phantom (20% phase). The tumor is highlighted by an red arrow and by the sagittal zoom-in on the right. The red circles highlight regions where AAIR resulted in noticeable improvements. (C/W = 0.0115/0.023 mm−1)

