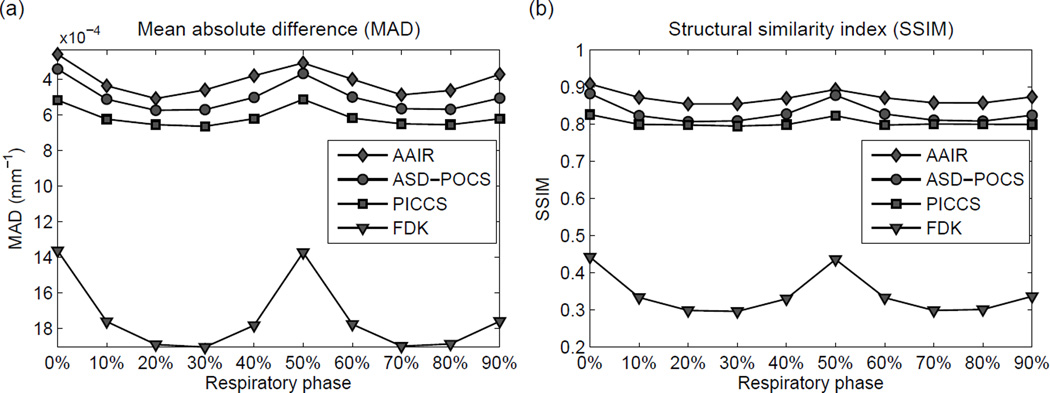
Figure 9.
(a) The mean absolute differences (MAD) of all ten phases of the reconstructed phantom images. A lower MAD indicates a more accurate reconstruction of the ground truth. Note that the y-axis has been inverted so that an upward trend corresponds to better image quality. (b) The structural similarity (SSIM) indices of all ten phases of the reconstructed phantom images. A higher SSIM indicates a more accurate reconstruction of the ground truth.

