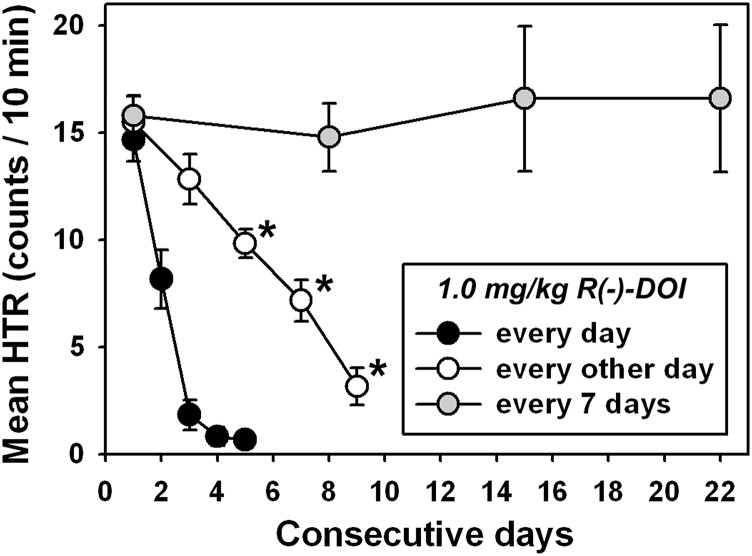
Fig. 4.
Tolerance development to HTR elicited by different frequencies of 1.0 mg/kg DOI administration. For ease of comparison, data from daily administration of 1.0 mg/kg DOI have been replotted from Fig. 3 (●) without indications of statistical significance, whereas open circles represent administration of 1.0 mg/kg DOI every other day, and gray circles represent administration of 1.0 mg/kg DOI every 7 days. All other graph properties are as described in Fig. 3. *P < 0.05.

