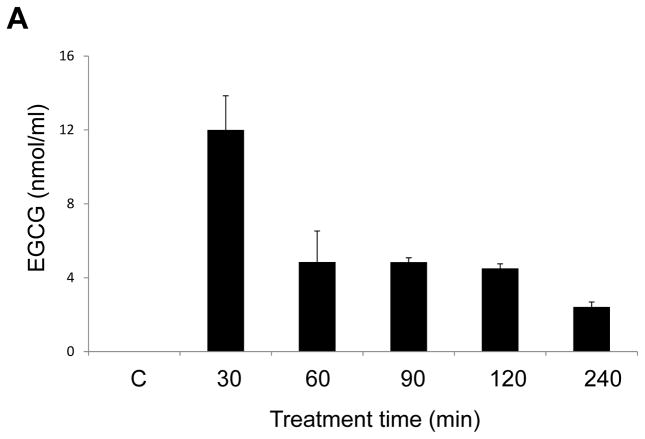
Figure 2.

EGCG quantification in endothelial cells was performed by LC/MS/MS analysis. Endothelial cells were treated with EGCG (30 μM) for up to 240 min, and EGCG levels were measure by LC/MS/MS in the media (Figure 2A) and cells (Figure 2B). In separate experiments, endothelial cells were treated with increasing concentrations of EGCG (0–180 μM) for 1h, before measuring cellular levels of EGCG (Figure 2C). Results shown represent the mean ± SEM of three independent experiments.


