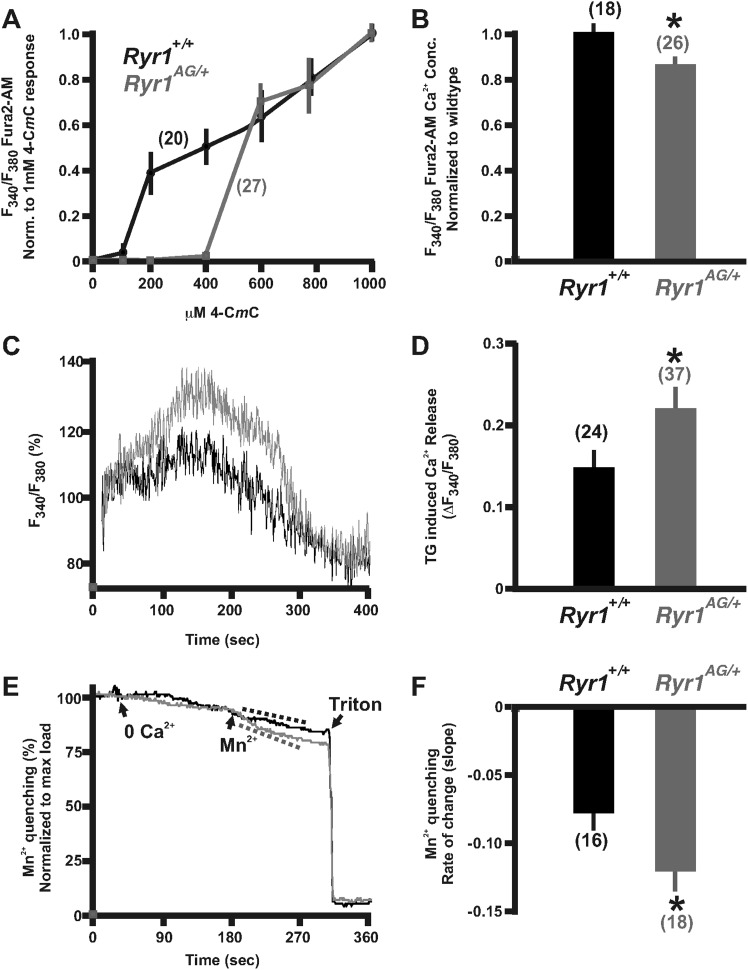
Figure 2. Calcium homeostasis is disrupted in Ryr1AG/+ muscle.
Fura-2 ratiometric imaging of myoplasmic Ca2+ in 2-month old muscle. (A) Ratiometric analysis of 4-CmC sensitivity in soleus muscles of wild-type (black) and Ryr1AG/+ littermates (grey). (B) Average ratiometric analysis of myoplasmic Fura-2 signal normalized to wild-type signal (n above bar represents number of analyzed fibers). (C) Representative fura-2 ratiometric signal of muscle fibers showing percent change after addition of 20 μM thapsigargin (TG) from wild-type (black) and Ryr1AG/+ (grey) littermate. (D) TG induced maximum response in muscle fibers (n above bar represents number of analyzed fibers). (E, F) Representation and quantification of Mn2+ quenching of Fura-2 fluorescence ratiometric signal illustrating increased influx of store operated calcium entry in soleus muscle fibers of Ryr1AG/+ (grey) muscle fibers compared to wild-type (black) muscle fibers (dash lines represent slope). In (E), arrows indicate when media was introduced with 0 Ca2+ followed by 0.5 mM Mn2+.

