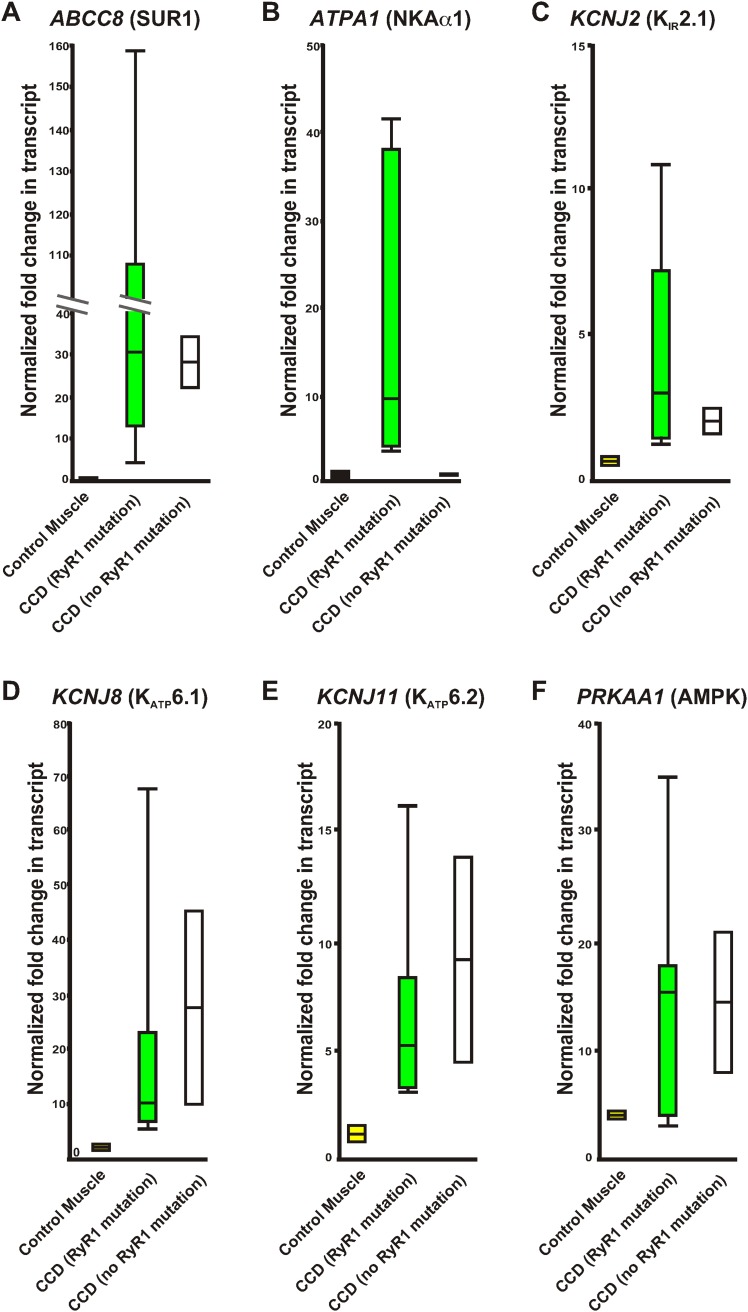
Figure 9. Relative variation of quantitative qRT-PCR of human control RNA and RNA from human muscle biopsies.
Whisker plots derived from the data in Table 2 of control muscle (yellow), congenital myopathy (CCD) with a mutation in RyR1 (green), and without a mutation in RyR1 (white). (A) ABCC8, (B) ATPA1, (C) KCNJ2, (D) KCNJ8, (E) KCNJ11, (F) PRKAA1. Values normalized to GAPDH before normalization to pooled control human muscle RNA.

