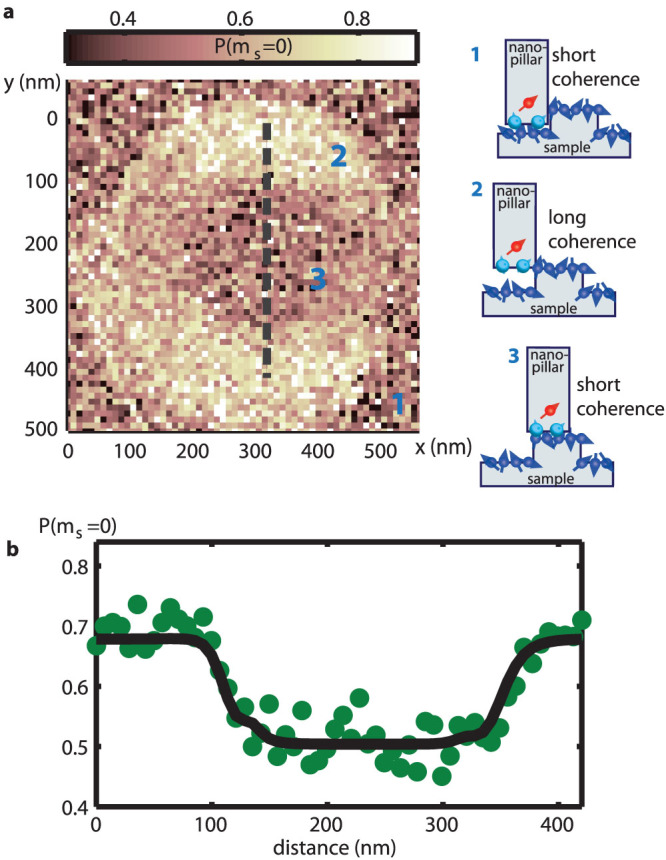
Figure 3. NV spin decoherence images indicating effect of surface paramagnetic impurities.

(a): Two-dimensional decoherence image as the nanopillar scans over the sample mesa while running the Hahn-echo sequence with t = 40 μs averaging 2.1 s per pixel. The measured coherence diminishes when the NV spin is in close proximity to the sample surface, giving the dark inner circle and the dark outer region in the image. Also shown are sketches illustrating the relative position of the NV spin to the sample at different regions as marked in the image. (b): One-dimensional scan along the dashed line in a averaging 40 s per pixel while running the Hahn-echo sequence with t = 40 μs. The scanning nanopillar is in contact with the sample mesa for the entire scan. The NV spin coherence is high when the NV center is suspended above the surface and has a sharp transition to zero (P(ms = 0) = 0.5) when it reaches the mesa. The solid line is the fit described in the main text, from which we obtain d = 29.7 ± 5.8 nm and τc = 2.5 ± 1.0 μs. In the fit, the NV spin is set to align with the sample mesa edges at x = 120 nm and x = 320 nm.
