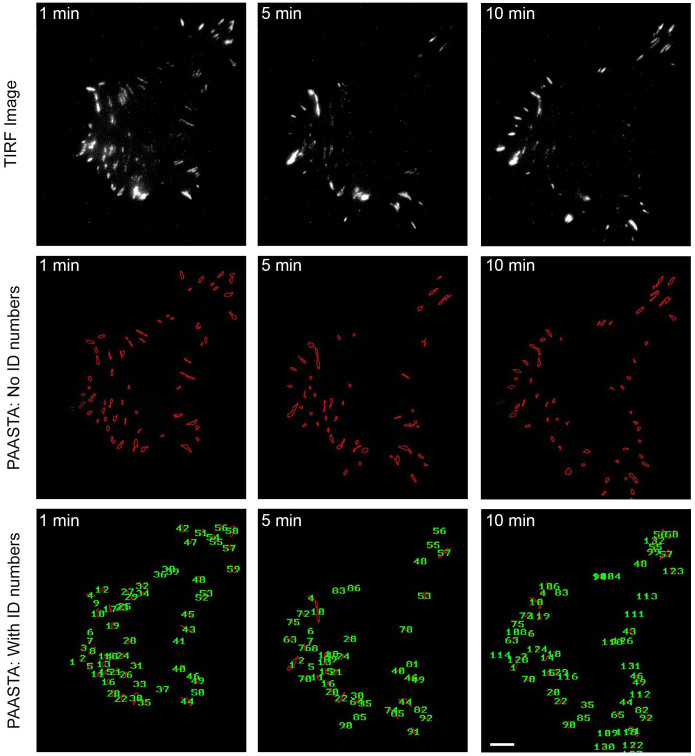
Figure 2. Adhesion identification and tracking using PAASTA.
Raw time-lapse TIRF images of an HT1080 cell expressing GFP-paxillin are shown (upper panels). These images were then processed with PAASTA to generate individual adhesion tracks that are shown in the lower panels both without labeling (No ID numbers) and with ID numbers labeling each adhesion (With ID numbers). Bar, 5 μm.

