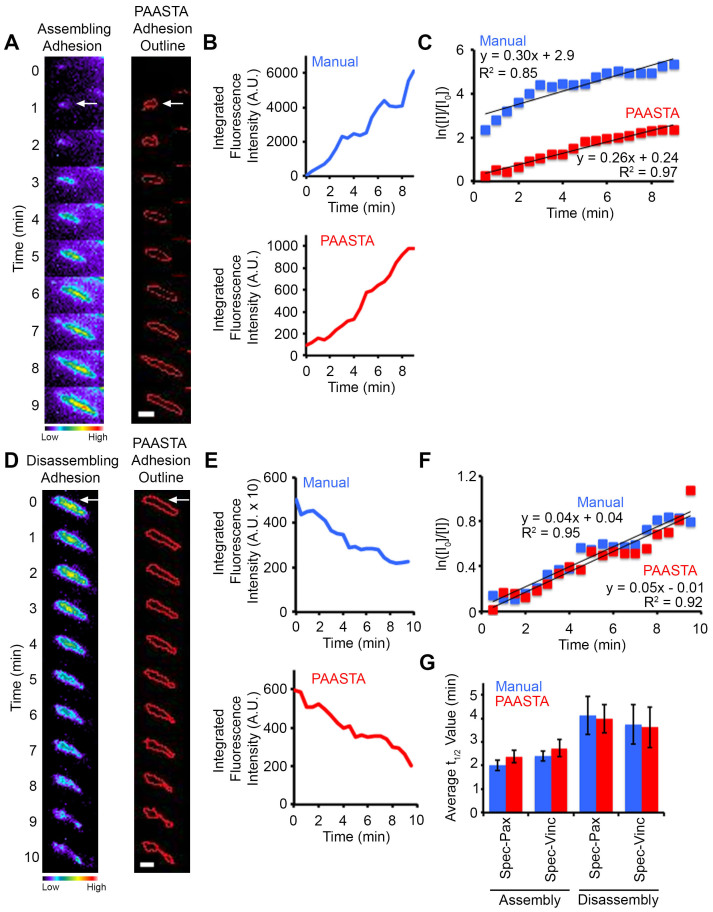
Figure 4. Manual and PAASTA analysis of adhesion assembly and disassembly in U2OS cells.
(A,D) Left, Montages of time-lapse TIRF images for an assembling (panel A) and disassembling (panel D) adhesion (white arrows) in cells expressing GFP-paxillin are shown in pseudo-color coding, which indicates the range of fluorescence intensities. Cool colors correspond to lower intensity values, and warm colors correspond to higher intensity values. Right, Outlines of the adhesions as segmented by PAASTA. (B,E) Graphs of the fluorescence intensities of the assembling (panel B) and disassembling (panel E) adhesion are shown for both Manual and PAASTA tracking. (C,F) Plots of the natural log of the fluorescence intensity of the adhesions at given time points (I) relative to the initial fluorescence intensity (I0) are shown. Trendlines with the corresponding equation (y = mx + b) and R2 values are shown for fluorescence intensities that were obtained manually (Manual) and with PAASTA. The slopes of these graphs (m) are the apparent rate constant for adhesion assembly (panel C) or the rate constant for adhesion disassembly (panel F). (G) The average t1/2 values for adhesion assembly and disassembly for cells expressing Spec-Pax or Spec-Vinc are shown for Manual and PAASTA adhesion tracking. S.E.M. was calculated from: 20–21 adhesions (10–11 assembly, 10 disassembly) for each construct. A total of 14 cells were analyzed for adhesion assembly and disassembly. A Wilcoxon rank sum test showed no statistically significant difference between Manual and PAASTA tracking for Spec-Pax assembly (Z = −1.682, p = 0.093), disassembly (Z = −0.153, p = 0.878); or Spec-Vinc assembly (Z = −1.112, p = 0.266), disassembly (Z = −0.255, p = 0.799). For panels A and D, Bar, 1 μm.

