


Table 3. Structure–activity relationships for carbamate and urea based HDAC inhibitors30 .

|
HDAC isoform inhibition IC50
a
(μM) |
[Brain]/[plasma] and brain free fraction b (%) | ||||
| Compound | R1 group | R2 group | HDAC1 | HDAC2 | HDAC3 | |
| 13 |

|

|
0.611 ± 0.253 | 1.00 ± 0.34 | 2.60 ± 0.09 | nd |
| 14 |

|

|
0.069 ± 0.031 | 0.104 ± 0.028 | 0.861 ± 0.141 | nd |
| 15 |

|
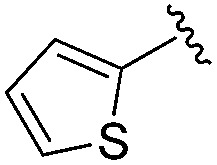
|
0.071 ± 0.009 | 2.64 ± 1.13 | 13.05 ± 3.04 | nd |
| 16 |

|

|
0.216 ± 0.050 | 0.912 ± 0.155 | 13.2 ± 2.19 | nd |
| 17 |

|

|
0.010 ± 0.002 | 0.059 ± 0.021 | 1.47 ± 0.25 | nd |
| BRD3321 |

|

|
0.019 ± 0.005 | 0.233 ± 0.053 | 1.75 ± 0.25 | nd |
| BRD0302 |

|

|
0.113 ± 0.015 | 1.29 ± 0.55 | 9.22 ± 2.06 | nd |
| Ki (μM) | ||||||
| 0.111 | 2.74 | 17.7 | ||||
| Residence time T 1/2 (min) | ||||||
| 308 | 375 | 231 | ||||
| BRD6688 |

|

|
0.021 ± 0.013 | 0.100 ± 0.048 | 11.48 ± 2.54 | 0.26 |
| 54% | ||||||
| Residence time T 1/2 (min) | ||||||
| 65 | 381 | 280 | ||||
| 18 |

|

|
0.093 ± 0.022 | 0.176 ± 0.100 | 10.15 ± 3.27 | nd |
| 19 |

|

|
0.024 ± 0.001 | 0.271 ± 0.086 | 1.96 ± 1.34 | nd |
| BRD3227 |

|

|
0.043 ± 0.024 | 0.291 ± 0.141 | 23.5 ± 6.7 | 0.01 |
| 20 |

|

|
0.035 ± 0.012 | 0.238 ± 0.107 | 5.07 ± 0.93 | 0.19 |
| 21% | ||||||
| Residence time T 1/2 (min) | ||||||
| 165 | 513 | 495 | ||||
| BRD3386 |

|

|
0.026 ± 0.007 | 0.178 ± 0.058 | 3.13 ± 0.90 | 0.34 |
| 22% | ||||||
| Residence time T 1/2 (min) | ||||||
| 570 | 660 | 495 | ||||
| BRD8951 |

|

|
0.001 ± 0.001 | 0.011 ± 0.003 | 0.544 ± 0.205 | 0.27 |
| 2% | ||||||
| Residence time T 1/2 (min) | ||||||
| 2100 | 788 | ND | ||||
| BRD4161 |

|

|
0.007 ± 0.002 | 0.045 ± 0.010 | 3.46 ± 0.89 | 0.11 |
| 23% | ||||||
| Residence time T 1/2 (min) | ||||||
| 430 | 788 | 770 | ||||
aValues are the mean of a minimum of two experiments. Data are shown as IC50 values in μM ± standard deviation. Compounds were tested in duplicate in a 12-point dose curve with 3-fold serial dilution starting from 33.33 μM. nd = not determined.
bBrain free fraction estimated based on brain tissue binding experiments.