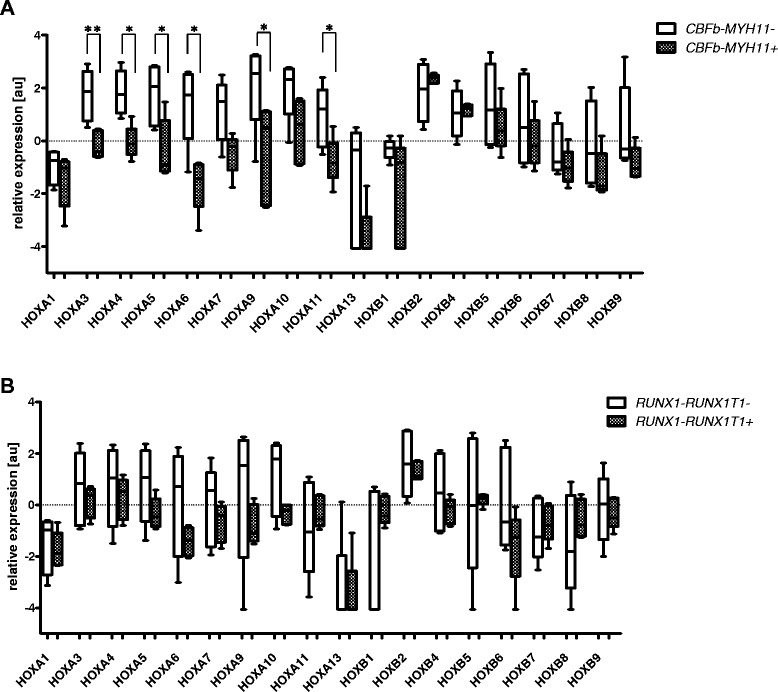
Figure 2.

Differing HOX gene expression levels observed in FAB subtypes with respect to the presence of typical molecular aberrations. A. CBFb-MYH11+/− patients with AML M4. Asterisks indicated statistical significance (* ≤ 0.05, ** ≤ 0.01; additional borderline significance: p = 0.0679 for HOXA7, HOXA10 and HOXB9, p = 0.0732 for HOXA13); B. RUNX1-RUNX1T1+/− patients with AML M2. Asterisks indicated statistical significance (* ≤ 0.05, ** ≤ 0.01; additional borderline significance: p = 0.1745 for HOXA5, p = 0.1745 for HOXA9 and P = 0.1172 for HOXA10).
