Figure 4.

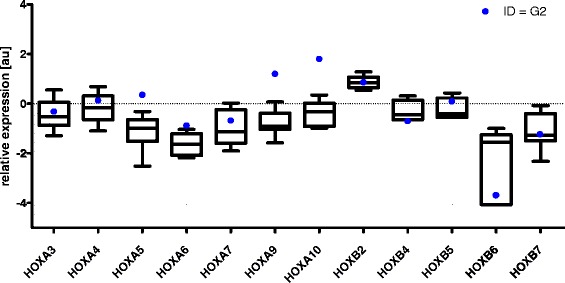
HOX gene expression patterns in corresponding differentiation stages of normal and malignat hematopoiesis. Comparison of HOX gene expression patterns between AML M3 and sorted subpopulation of healthy BM cells (ID = G2).

HOX gene expression patterns in corresponding differentiation stages of normal and malignat hematopoiesis. Comparison of HOX gene expression patterns between AML M3 and sorted subpopulation of healthy BM cells (ID = G2).