Abstract
Harmonisation of reference intervals for routine general chemistry analytes has been a goal for many years. Analytical bias may prevent this harmonisation. To determine if analytical bias is present when comparing methods, the use of commutable samples, or samples that have the same properties as the clinical samples routinely analysed, should be used as reference samples to eliminate the possibility of matrix effect. The use of commutable samples has improved the identification of unacceptable analytical performance in the Netherlands and Spain. The International Federation of Clinical Chemistry and Laboratory Medicine (IFCC) has undertaken a pilot study using commutable samples in an attempt to determine not only country specific reference intervals but to make them comparable between countries. Australia and New Zealand, through the Australasian Association of Clinical Biochemists (AACB), have also undertaken an assessment of analytical bias using commutable samples and determined that of the 27 general chemistry analytes studied, 19 showed sufficiently small between method biases as to not prevent harmonisation of reference intervals. Application of evidence based approaches including the determination of analytical bias using commutable material is necessary when seeking to harmonise reference intervals.
Introduction
The most commonly used decision making tool in medicine is the reference interval.1 As practical medicine is basically founded on comparison,2 any laboratory result needs to be accurate, comparable and be able to be interpreted reliably in a consistent manner.3 Reference limits or intervals are important benchmarks or tools that allow the clinician a vehicle for appropriate and reliable clinical interpretation.4
The need to progress the implementation of common reference intervals has become urgent as the integration of results from different laboratories using multiple reference intervals into the future national e-health framework will be difficult if not impossible. Similarly, the importance and advantage today of capturing all laboratory results for a patient in a single electronic file, electronic medical record (EMR) or electronic health record (EHR), may be negated if common reference intervals are not in use. The potential confusion for clinicians to interpret laboratory results with these differences in reference intervals between laboratories could contribute to unnecessary testing, inappropriate investigations or treatments. It is recognised that there are often sound scientific reasons for differences in reference intervals such as ethnicity and analytical methodology, however, the UK Pathology Harmony study found that laboratories using the same analytical platform and reagents often had different reference intervals with no sound basis for these differences.5
Fraser and Petersen suggest that the basic concept first proposed by Gowans in 1988, that in a homogeneous population, laboratories should ideally use the same reference interval.6 Where there is adoption of assays with metrological traceability, there should be equivalence in patient results. The two important limits that should be defined for the clinical application of any test are the allowable limits for the uncertainty of the manufacturer’s calibrators and the allowable error at the individual laboratory or the bias of the measurements.7 Harmonising reference intervals requires knowledge and understanding of analytical bias. As it is not possible to have a perfect system, tolerances must be established. Bias in a laboratory sense is a testing error that causes a systematic favouring of some outcome over others which could prevent reasonable and objective consideration of a clinical situation. To harmonise reference intervals the bias (BA) should be < 0.25√ (CVI2 + CVG2). Fraser and Petersen6 later recommended that bias performance should be:
Where:
CVI = within individual variation
CVG = between individual variation
The presence and magnitude of any bias can be obtained by comparing results obtained by the various analytical methods using shared patients’ samples, samples from External Quality Assurance Programs or inter-laboratory internal quality control programs.8,9 Results tend to show greater variability and method dependence when using “artificial” material rather than fresh or frozen patient samples. The method differences seen using these artificial materials such as QA material are commonly due to matrix effects.8 To assess whether these artificial materials behave in the same manner as authentic clinical samples and are suitable for analysis of bias, commutability should be determined. Without assessment of commutability it is not possible to determine whether any biases observed are artefactual or genuine.10
Commutability
Commutability is a property of reference materials and is where those materials have the same inter-assay relationships to those of clinical samples.11 In other words, commutability may be defined as the equivalence of the mathematical relationships between the results of different measurement procedures for a reference material and for representative samples from healthy and diseased individuals. Commutability does not imply accuracy of results, only that results for a reference material had the same mathematical relationship between methods that was observed for native clinical samples measured by those methods.12
When commutability of a reference material cannot be established, results from various analytical methods using that material cannot be reliably compared. Any observed differences could be attributed to the non-commutability, or aspects of the method used including the method itself and calibration and reagent lot number. These non-commutability differences or limitations may also be seen between different reagent lot numbers.13
Matrix Effect
All components of the material except the analyte in question have the ability to cause bias. The bias caused by differences in sample matrix has been termed matrix effect, matrix bias or matrix related bias. A matrix effect can be defined as the influence of a property of the sample in question, other than the analyte in question, on the measurement of that analyte and subsequent concentration obtained. Enzyme-protein complexes that have been modified during their isolation from human sources, and other non-native forms of the analyte can also produce differences in concentrations obtained.9 If comparing methods using artificial material, the magnitude of any differences caused by this difference in matrix cannot be predicted and may be variable between methods and also between reagent lot numbers of the same method.
Studies using Commutable Samples
Reference interval studies that have been established using commutable samples include the International Federation of Clinical Chemistry and Laboratory Medicine (IFCC) Committee on Reference Intervals and Decision Limits (C-RIDL)’s world-wide study whose ambitious objective is to establish country specific reference intervals and to make results comparable across countries. To date this initiative has been largely exploratory but the study has suggested between-day variation may be more important than within-day variation and that 40 samples should be measured over 4–8 separate days.14 In a study by Stepman et al. they tested the assumption that laboratories using CE-marked assays should be able to assume interchangeability of measurement results.15 This study determined the analytical bias of eight common analytes without the impediment of potential commutability issues by using 20 freshly frozen serum samples analysed in 63 laboratories on six different analytical platforms. This study demonstrated that results obtained within commonly used reference intervals in some instances showed differences of >30%. A five year study from the Netherlands using commutable EQA samples prepared from leftover routine laboratory samples, concluded that use of these samples better allowed identification of deterioration in assay performance and a better insight into overall method performance and standardisation efforts.16 The Spanish Society of Clinical Biochemistry and Molecular Pathology, in a pilot collaboration, adopted the Dutch category 1 EQA scheme, SKML, a scheme where commutable material have concentrations assigned by reference methods, and compared their findings with those of the Spanish category 5 scheme where replicate analyses of non-commutable material with no concentrations assigned by reference methods are used.17 This study identified that the most likely explanation for unacceptable performance in EQA schemes is the lack of commutability of the material used.
Australian/New Zealand Experience
Because the method differences seen using artificial material in the Royal College of Pathologists of Australasia Quality Assurance Programs (RCPAQAP) program may be due to matrix effects,6 a study was undertaken by the AACB to determine bias using unadulterated commutable human serum.
Twenty-four public and private laboratories throughout Australia and New Zealand representing the eight major chemistry platforms as determined by reviewing the RCPAQAP enrolments (Abbott Architect, Roche Modular and Integra, Beckman Coulter Dx series and Olympus, Siemens Advia and Dimension and Ortho Clinical Diagnostics Vitros) were requested to analyse 33 serum samples for 27 common analytes. These analytes included routine liver and kidney function tests, lipids, iron studies, C-reactive protein, calcium including albumin correction, magnesium, phosphate and urate. Some central laboratories also analysed these samples at their peripheral laboratory sites and the subsequent total number of platforms used was increased to 36 (Table 1). Where manufacturer consolidation has occurred, as with Siemens and Dade and Olympus with Beckman and harmonisation of consumables had not occurred, these groups were considered separately in this study.
Table 1.
Manufacturer and analyser numbers
| Manufacturer | Platform | Number |
|---|---|---|
| Roche | Cobas Modular series | 7 |
| Integra I800 | 2 | |
| Integra I400 | 1 | |
| Abbott | c16000/ci16200 | 3 |
| c8000/ci8200 | 3 | |
| Siemens | Advia 2400 | 3 |
| Advia 1800 | 1 | |
| Dimesion RxL | 5 | |
| Beckman | Dx series | 4 |
| Olympus AU 2700 | 3 | |
| Olympus AU 5822 | 1 | |
| Ortho | Vitros Fusion 5.1 | 3 |
The serum samples used in this study were from single volunteers (24/33), however, 9/33 were from pooled serum samples ensuring that the entire generally accepted reference interval concentrations for each analyte was covered. All samples used were processed, including initial biochemical analysis, and frozen at −80°C within four hours of collection. Transportation to the testing laboratories was overnight on dry ice to minimise any deleterious effect on analyte stability. Laboratories were asked to thaw and centrifuge the samples prior to analysis and to assay five RCPAQAP samples which were provided in conjunction with the human samples. The RCPAQAP material was unused samples from a program that had been undertaken within the previous 12 months.
The laboratories were requested to record all results as well as the reagent manufacturer, reagent lot number analytical method (e.g. hexokinase), calibrator manufacturer, lot number and traceability information. The samples were not assigned a concentration as they were not assessed using reference methods.
The results were used to compare the average analytical platform result with the mean of all results to determine bias. Using the RCPAQAP allowable limits of performance (ALE) a ‘Traffic Light’ system was established to determine the contribution of analytical bias to the establishment of common reference intervals
- ▪ GREEN Bias would not prevent common reference intervals
- ○ All results fall within the RCPAQAP allowable limits of performance for the analyte
- ○ Regression line does not cross the RCPAQAP allowable limits of performance within the current manufacturer quoted reference intervals
- ▪ AMBER Bias may prevent common reference intervals
- ○ No more than four results fall outside the RCPAQAP allowable limits of performance for the analyte
- ○ Regression line does not cross the RCPAQAP allowable limits of performance within the current manufacturer quoted reference intervals
- ▪ RED Bias probably prevents common reference intervals
- ○ Greater than four results fall outside the RCPAQAP allowable limits of performance for the analyte
- ○ Regression crosses the RCPAQAP allowable limits of performance within the current manufacturer quoted reference intervals
The RCPAQAP allowable limits are based on a combination of biological variation and professional opinion with the criteria that methods with results within these limits can share reference intervals or, for some analytes, monitor patients.18
The study demonstrated that using serum samples from healthy volunteers with analyte concentrations spanning existing or manufacturer recommended reference intervals, 19 of the 27 common biochemical analytes assessed showed sufficient similarity to not prevent harmonised reference intervals being adopted. Table 2 shows the ‘Traffic Light’ classification of the 27 analytes. Lipase, LD, ALT, AST and albumin showed sufficient bias attributed to method differences suggesting that at least two method-specific reference intervals would be required. GGT showed up to four discrete method groups.19
Table 2.
‘Traffic Light’ classification of assays.
| Analyte | Bias Classification | ||
|---|---|---|---|
| Sodium | Green | ||
| Potassium | Green | ||
| Chloride | Green | ||
| Bicarbonate | Red | ||
| Urea | Green | ||
| Creatinine | Green | ||
| ALT * | Amber | ||
| AST * | Amber | ||
| GGT | Red | ||
| ALP | Green | ||
| Total Protein | Green | ||
| Albumin * | Amber | ||
| Total Bilirubin | Red | ||
| Calcium | Green | ||
| Magnesium | Green | ||
| Phosphate | Green | ||
| Urate ^ | Green | ||
| CK | Green | ||
| LD* | Amber | ||
| Iron | Green | ||
| Transferrin | Green | ||
| CRP ** | Green | ||
| Lipase* | Amber | ||
| Cholesterol | Green | ||
| Triglycerides | Green | ||
| HDL-C | Green | ||
| Glucose | Green | ||
Method dependent
Excluding Siemens Dimension
Excluding OCD Vitros
In Table 2 the average bias for all 27 assays is compared with the all analyser means. An example of a ‘green analyte’, potassium is shown in Figures 1 and 2 where acceptable bias is demonstrated using regression analysis and in a difference plot.
Figure 1.
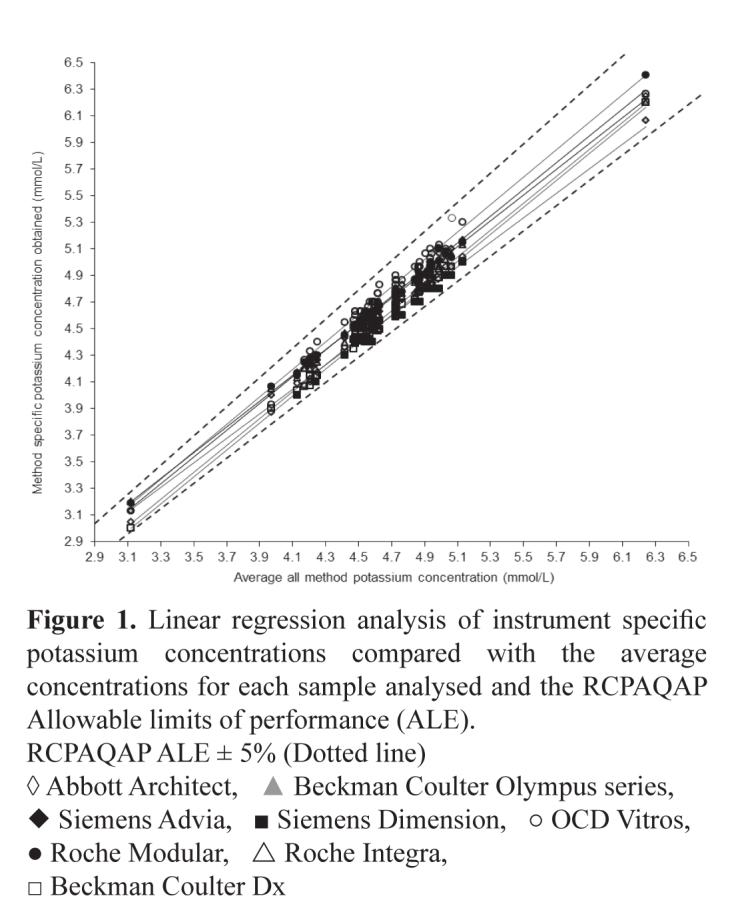
Linear regression analysis of instrument specific potassium concentrations compared with the average concentrations for each sample analysed and the RCPAQAP Allowable limits of performance (ALE).
RCPAQAP ALE ± 5% (Dotted line)
◊ Abbott Architect, ▲ Beckman Coulter Olympus series, ◆ Siemens Advia, ■ Siemens Dimension, ○ OCD Vitros, ● Roche Modular, △ Roche Integra, □ Beckman Coulter Dx
Figure 2.
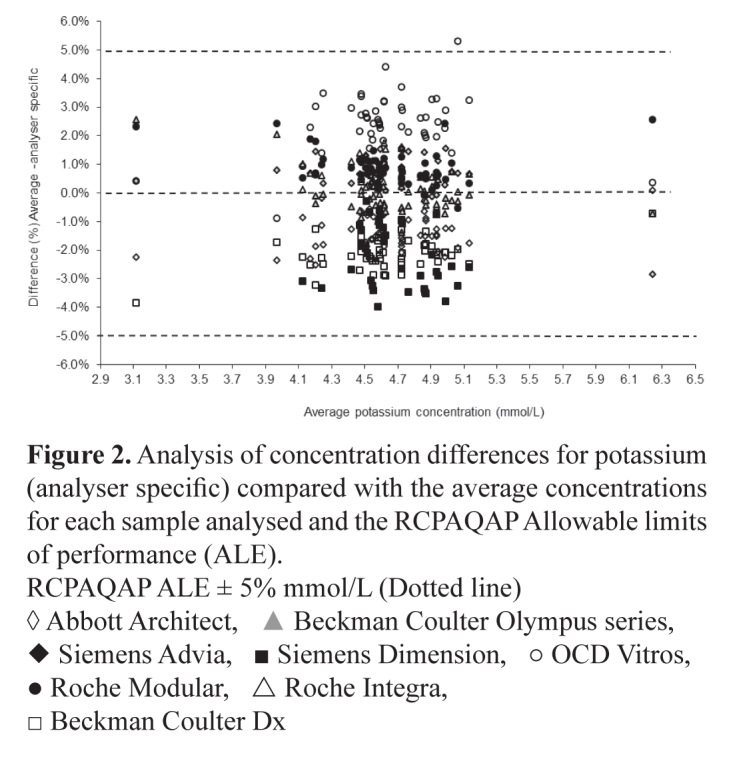
Analysis of concentration differences for potassium (analyser specific) compared with the average concentrations for each sample analysed and the RCPAQAP Allowable limits of performance (ALE).
RCPAQAP ALE ± 5% mmol/L (Dotted line)
◊ Abbott Architect, ▲ Beckman Coulter Olympus series, ◆ Siemens Advia, ■ Siemens Dimension, ○ OCD Vitros, ● Roche Modular, △ Roche Integra, □ Beckman Coulter Dx
There was a positive bias in ALT results from those laboratories using pyridoxyl-5-phosphate (P-5-P) as an activator compared with those not using P-5-P. This bias ranged from 20-40%. The comparison between ALT and AST reagent with and without using P-5-P was assessed using the OCD Vitros systems. This sub-study produced ALT concentrations ∼40% higher where P-5-P was used as an activator (Table 3). This difference was not as marked with AST where the average difference was ∼22%. The bias was less pronounced with ALT concentrations >30 U/L reducing to 15-32% as shown in Figure 3. This difference >30 U/L was not seen with AST. The results of a further sub-study undertaken comparing the Abbott P-5-P activated ALT assay and the non-activated assay are seen in Figure 4. These results show the activated assay approximately 20% higher but with significant variation in results below 50 U/L. Comparing the activities obtained using Abbott and Vitros activated assays showed comparable results >50 U/L but very divergent results <50 U/L (Figure 5). It is speculated that laboratories choose to use the non-activated transaminase assays on the assumption that their patient populations are not P-5-P deficient and little difference in results would be obtained if samples were tested using both activated and unactivated assays. This may not be a reasonable assumption as this study using samples from apparently healthy individuals shows large differences in transaminase activities particularly where results <50 U/L are obtained. The use of the activated versions of these assays that are traceable to the IFCC reference methods has been recommended and would aid in the harmonisation of transaminase reference intervals.
Table 3.
Analytical platform average bias (%) of 27 common analytes compared with the RCPAQAP Allowable Limits of Performance (%).
| RCPA QAP Allowable limits | Abbott Architect | Roche Modular | Roche Integra | Beckman Coulter Dx | Olympus | Siemens Advia | Siemens Dimension | OCD Vitros | |
|---|---|---|---|---|---|---|---|---|---|
| Sodium | 2 | −0.7 | 0.9 | −0.1 | −2.0 | 0.8 | 0.7 | −0.4 | 0.4 |
| Potassium | 5 | −1.4 | 0.7 | 0.7 | −2.2 | −0.1 | 0.8 | −2.2 | 2.6 |
| Chloride | 3 | 1.2 | 0.4 | −0.8 | −2.4 | 1.0 | 0.5 | −1.0 | 0.0 |
| Bicarbonate | 10 | −3.2 | −1.4 | −5.8 | 4.4 | −0.5 | 0.8 | 4.9 | 0.1 |
| Urea | 12 | 3.8 | 0.9 | 2.7 | 2.3 | −4.5 | −9.2 | −0.1 | 2.7 |
| Creatinine∼ | 8 | 0.3 | 2.0 | −1.5 | 1.0 | −3.7 | 1.7 | 1.5 | −1.9 |
| ALT | 12 | −0.9 | −2.3 | −6.9 | 13.7 | 2.2 | −3.0 | 5.0 | −4.7 |
| ALT (P-5-P) * | 12 | 41.9 | |||||||
| AST* | 12 | −0.9 | −5.1 | −3.8 | 9.3 | 2.6 | 0.4 | −7.4 | |
| AST (P-5-P) * | 12 | 22.3 | |||||||
| GGT | 12 | 10.6 | −6.5 | −7.1 | −17.7 | 4.9 | 3.4 | 3.9 | 2.4 |
| ALP | 12 | −0.1 | −6.2 | −1.7 | −4.8 | 9.7 | −3.4 | −2.0 | 8.4 |
| Total Protein | 5 | −0.7 | −1.0 | −0.2 | −3.4 | 2.8 | −0.2 | 3.2 | −0.3 |
| Albumin (BCP) | 6 | −1.8 | 2.4 | 2.2 | −1.9 | 0.7 | |||
| Albumin (BCG) | 6 | −1.4 | 4.2 | −2.9 | −2.7 | −2.3 | −3.0 | ||
| Total Bilirubin | −3.2 | −12.3 | −32.1 | 87.4 | 71.4 | −2.7 | −8.4 | −66.8 | |
| Calcium | 4 | 0.5 | −1.7 | 1.4 | −1.3 | 0.6 | 0.6 | −2.9 | 2.8 |
| Magnesium | 8 | 3.5 | −1.5 | −3.7 | 0.6 | 0.2 | 3.1 | −4.4 | −2.4 |
| Phosphate | 8 | −0.1 | −1.3 | −0.5 | 4.6 | −0.7 | −3.0 | −0.1 | 6.7 |
| Urate | 8 | 2.4 | −0.1 | −2.0 | 2.8 | −0.2 | 2.6 | −7.7 | 0.6 |
| CK | 12 | 6.0 | −2.3 | −7.9 | 3.6 | 6.3 | −5.2 | −1.4 | −1.5 |
| LD (L-P) | 12 | −4.0 | −2.2 | 3.4 | 0.6 | 4.0 | −1.5 | 1.7 | |
| Iron | 12 | −3.8 | −0.2 | 2.2 | −0.6 | −0.9 | 1.5 | 0.0 | 5.6 |
| Transferrin | 8 | −4.8 | 1.2 | 0.0 | −1.3 | 0.2 | 5.2 | 0.0 | −3.1 |
| CRP | 20 | 1.2 | −11.8 | −5.2 | 2.1 | −10.8 | −1.3 | −3.8 | 25.3 |
| Lipase | 40 | −3.6 | 13.4 | 13.2 | −10.9 | −10.2 | 0.5 | ||
| Cholesterol | 6 | −0.1 | −0.9 | 0.8 | −1.6 | 3.0 | −0.6 | −6.4 | 3.4 |
| Triglycerides | 12 | −2.2 | −2.2 | 2.1 | −8.1 | 6.2 | 0.5 | −4.1 | 0.0 |
| HDL-C | 12 | 3.3 | −1.5 | 1.8 | 2.2 | −3.3 | −1.8 | −2.1 | 3.7 |
| Glucose | 8 | 0.5 | 1.0 | 0.6 | −0.9 | 0.2 | 1.2 | −0.3 | −3.0 |
All creatinine assays Jaffe alkaline picrate except Vitros which is enzymatic.
OCD and Siemens provided ALT and AST reagents including and excluding P-5-P.#
Figure 3.

Analysis of activity difference between all ALT methods (P-5-P activation and no activation) compared with average activities of all method and RCPAQAP Allowable limits of performance (ALE).
RCPAQAP ALE ±12% (Dotted line)
● Assays using P-5-P activation, ○ Assays not using P-5-P activation
Figure 4.
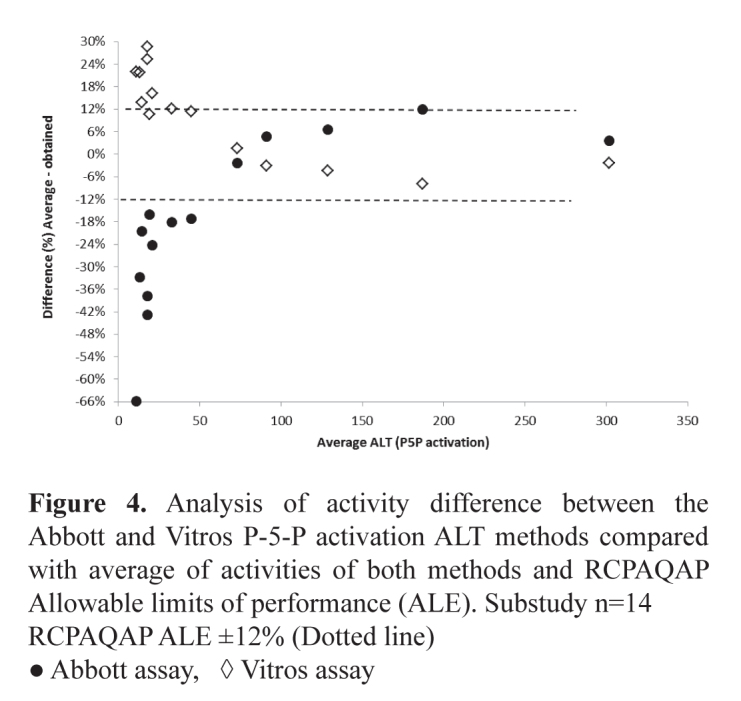
Analysis of activity difference between the Abbott and Vitros P-5-P activation ALT methods compared with average of activities of both methods and RCPAQAP Allowable limits of performance (ALE). Substudy n=14
RCPAQAP ALE ±12% (Dotted line)
● Abbott assay, ◊ Vitros assay
Figure 5.
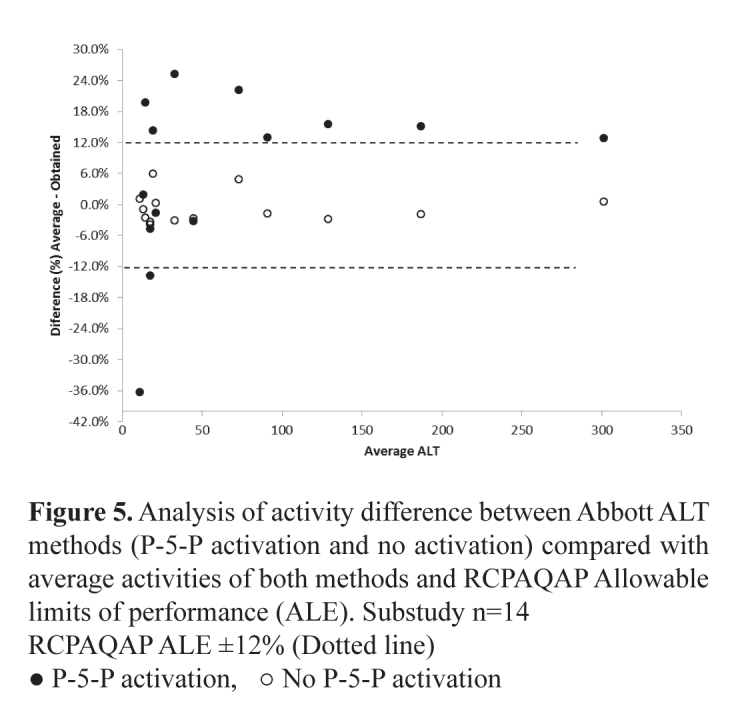
Analysis of activity difference between Abbott ALT methods (P-5-P activation and no activation) compared with average activities of both methods and RCPAQAP Allowable limits of performance (ALE). Substudy n=14
RCPAQAP ALE ±12% (Dotted line)
● P-5-P activation, ○ No P-5-P activation
GGT, shown in Figure 6, demonstrated up to four discrete method groups albeit that all but the Beckman Coulter Dx series results fell within the RCPAQAP allowable limits of performance (±12%). The Beckman Coulter Dx series results were 18–20% lower than the average results over the range 20–130 U/L. At concentrations >80 U/L there was a maximum total bias difference of 15% for results produced by all other methods. At concentrations <40 U/L this difference spanned the total allowable limit of performance. These differences were mirrored with the results obtained using the RCPAQAP samples. Whilst all the methods were a modification of the IFCC recommended method, the variation in results seen between these methods may be a factor of the conditions under which the measurements are made. Procedures that measure the catalytic activity of the same enzyme but under different analytical conditions may produce different results.20
Figure 6.
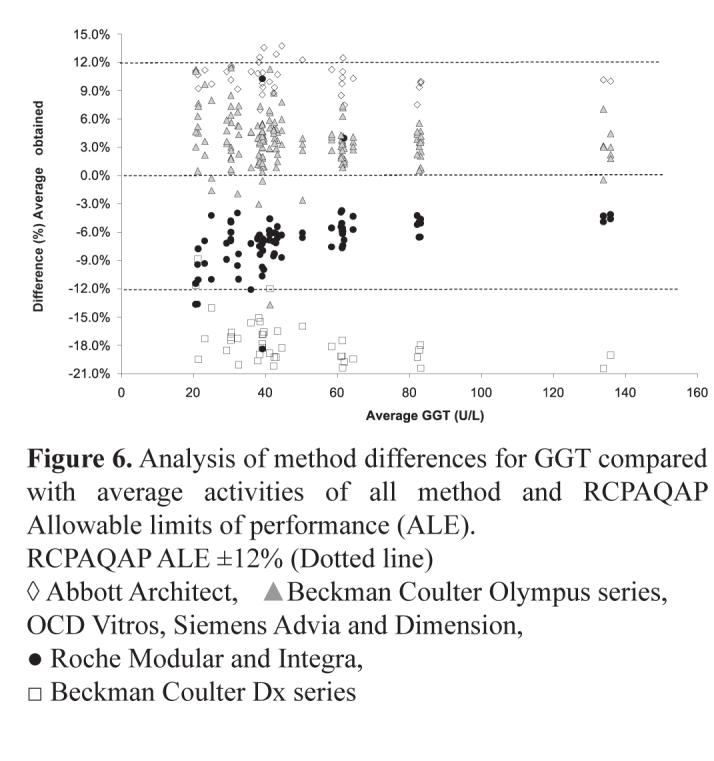
Analysis of method differences for GGT compared with average activities of all method and RCPAQAP Allowable limits of performance (ALE).
RCPAQAP ALE ±12% (Dotted line)
◊ Abbott Architect, ▲Beckman Coulter Olympus series, OCD Vitros, Siemens Advia and Dimension, ● Roche Modular and Integra, □ Beckman Coulter Dx series
These differences may be that there are variations in assay traceability to the IFCC defined reference measurement systems (RMS). Harmonisation of enzyme assays results will only occur with correct implementation of the RMS concept by the manufacturers and the verification of the compatibility of these methods.
The study also showed there was approximately a 3% difference between all methods at total calcium concentrations <2.20 mmol/L and a 5% difference at concentrations >2.55 mmol/L. It is worth noting that the albumin concentrations obtained with one method group were up to 6% higher than the average obtained for all methods. These higher albumin concentrations produced adjusted calcium results that were up to 0.15 mmol/L lower across the entire all-method average concentration range of 2.17–2.57 mmol/L. Whilst the difference in these results was within the ± 4% RCPAQAP allowable limits of performance, a clinician may find difficulty in interpreting adjusted calcium results produced by the different methods, given that serum albumin concentrations are less well harmonised. This difficulty would not be apparent with unadjusted or total calcium; however, for results at the upper limit of the reference interval, a bias of >0.05 mmol/L may be problematic.
A sub-study using BCP and BCG methods for albumin using the Roche Modular, Siemens Advia, Beckman Coulter Olympus and Abbott Architect demonstrated a total difference of about 5% when the concentration is >32 g/L increasing to 10% at concentrations <25 g/L (Figure 7). These differences highlight the need to use an appropriate method dependent equation when calculating the adjusted calcium concentration.
Figure 7.
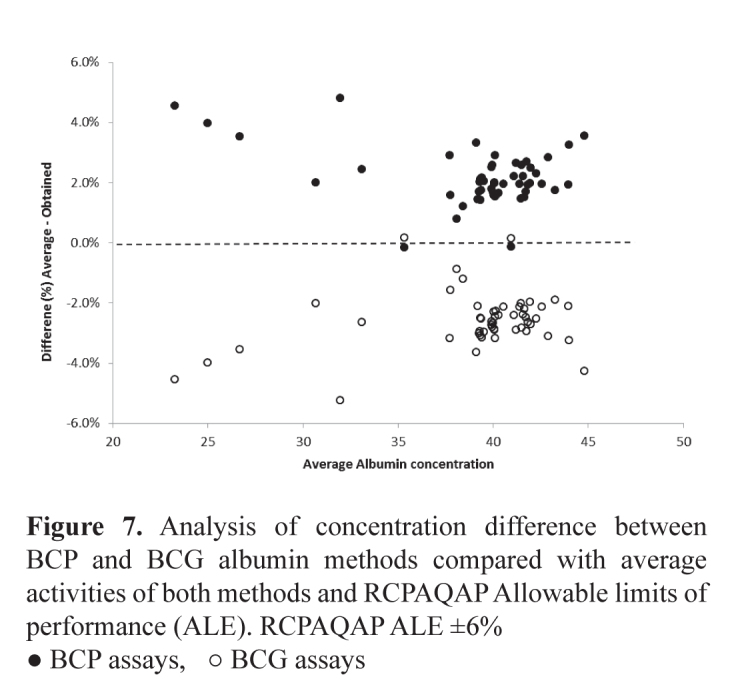
Analysis of concentration difference between BCP and BCG albumin methods compared with average activities of both methods and RCPAQAP Allowable limits of performance (ALE). RCPAQAP ALE ±6%
● BCP assays, ○ BCG assays
No significant differences were seen in results for like analysers such as the Abbott Architect c8000/ci8200 and c16000/ci16200, the Advia 2400 and 1800 and the Olympus 2700 and 5822. The two Roche systems, the modular series and Integra were generally comparable. Whilst some differences are seen in the direction and magnitude of the bias between methods on these analysers, only those annotated in the legend of Table 2 show significance, being outside the nominated allowable limits of error. Total bilirubin showed large differences between analyser groups, however these differences are most apparent at <5 mmol/L with the total difference between these analyser groups reducing to <+/−20% at 15 mmol/L. Results for the QAP samples analysed in parallel with the human samples, mirror these differences and further show that these differences reduce to <± 8% at 60 mmol/L.
Conclusions
When assessing an analyte’s performance, use of commutable material, as seen in the Dutch study, demonstrated an ability to more appropriately identify deterioration. The adoption of the SKML category 1 commutable material by the Spanish highlighted the advantages of using this type of material in a quality assurance program.
The AACB committee for Common Reference Intervals has identified difficulties that must be addressed with establishing harmonised reference intervals, including standardisation of the assay in question and establishing limits to the amount of bias and imprecision that should be allowed.
The use of commutable material to determine bias between methods for the analysis of general chemistry analytes is paramount in minimising the matrix effects caused by complexes that have been modified during their isolation from human sources, and other non-native forms of the analyte in question. Assay bias, if not identified and depending on the severity, can cause an increase in the percentage of false-positive or false negative decisions depending on the direction of the bias. The Australian study demonstrates that using commutable samples, bias, in many instances, does not prevent the adoption of common reference intervals.
The continuing application of an evidence-based approach including bias analysis in pursuing and determining harmonised reference intervals will meet the quality expectations of physicians who rely on these limits to undertake clinical decisions.
Footnotes
Competing Interests: None declared (GK, JT, KS, DK, MR, JG, GK, TY, AStJ, PH, AS, PG, JR) GRDJ has received research support from Roche and honoraria from Bio-Rad, Roche and Abbott Diagnostics.
References
- 1.Horn PS, Pesce AJ. Reference intervals: an update. Clin Chim Acta. 2003;334:5–23. doi: 10.1016/s0009-8981(03)00133-5. [DOI] [PubMed] [Google Scholar]
- 2.Schneider AJ. Some thoughts on normal, or standard, values in clinical medicine. Pediatrics. 1960;26:973–84. [PubMed] [Google Scholar]
- 3.Panteghini M, Ceriotti F. Obtaining reference intervals traceable to reference measurement systems: is it possible, who is responsible, what is the strategy? Clin Chem Lab Med. 2012;50:813–7. doi: 10.1515/cclm.2011.828. [DOI] [PubMed] [Google Scholar]
- 4.Plebani M, Lippi G. Reference values and the journal: why the past is now present. Clin Chem Lab Med. 2012;50:761–3. doi: 10.1515/cclm-2012-0089. [DOI] [PubMed] [Google Scholar]
- 5.Berg J, Lane V. Pathology Harmony; a pragmatic and scientific approach to unfounded variation in the clinical laboratory. Ann Clin Biochem. 2011;48:195–7. doi: 10.1258/acb.2011.011078. [DOI] [PubMed] [Google Scholar]
- 6.Fraser CG, Petersen PH. Analytical performance characteristics should be judged against objective quality specifications. Clin Chem. 1999;45:321–3. [PubMed] [Google Scholar]
- 7.Bais R, Armbruster D, Jansen RT, Klee G, Panteghini M, Passarelli J, et al. IFCC Working Group on Allowable Error for Traceable Results (WG-AETR) Defining acceptable limits for the metrological traceability of specific measurands. Clin Chem Lab Med. 2013;51:973–9. doi: 10.1515/cclm-2013-0122. [DOI] [PubMed] [Google Scholar]
- 8.Jones G, Barker A. Standardisation of reference intervals: an Australasian view. Clin Biochem Rev. 2007;28:169–73. [PMC free article] [PubMed] [Google Scholar]
- 9.Ceriotti F. Prerequisites for use of common reference intervals. Clin Biochem Rev. 2007;28:115–21. [PMC free article] [PubMed] [Google Scholar]
- 10.Miller WG, Myers GL, Rej R. Why commutability matters. Clin Chem. 2006;52:553–4. doi: 10.1373/clinchem.2005.063511. [DOI] [PubMed] [Google Scholar]
- 11.Miller WG, Tate JR, Barth JH, Jones GR. Harmonization: the sample, the measurement, and the report. Ann Lab Med. 2014;34:187–97. doi: 10.3343/alm.2014.34.3.187. [DOI] [PMC free article] [PubMed] [Google Scholar]
- 12.Clinical and Laboratory Standards Institute (CLSI) Characterization and qualification of commutable reference materials for laboratory medicine; approved guideline. Wayne, PA, USA: CLSI; 2010. Document EP30-A. [Google Scholar]
- 13.Miller WG, Erek A, Cunningham TD, Oladipo O, Scott MG, Johnson RE. Commutability limitations influence quality control results with different reagent lots. Clin Chem. 2011;57:76–83. doi: 10.1373/clinchem.2010.148106. [DOI] [PubMed] [Google Scholar]
- 14.Ichihara K, Ozarda Y, Klee G, Straseski J, Baumann N, Ishikura K, Committee on Reference Intervals and Decision Limits, International Federation for Clinical Chemistry and Laboratory Medicine Utility of a panel of sera for the alignment of test results in the worldwide multicenter study on reference values. Clin Chem Lab Med. 2013;51:1007–25. doi: 10.1515/cclm-2013-0248. [DOI] [PubMed] [Google Scholar]
- 15.Stepman HC, Tiikkainen U, Stöckl D, Vesper HW, Edwards SH, Laitinen H, et al. Participating Laboratories Measurements for 8 common analytes in native sera identify inadequate standardization among 6 routine laboratory assays. Clin Chem. 2014;60:855–63. doi: 10.1373/clinchem.2013.220376. [DOI] [PMC free article] [PubMed] [Google Scholar]
- 16.Cobbaert C, Weykamp C, Franck P, de Jonge R, Kuypers A, Steigstra H, et al. Systematic monitoring of standardization and harmonization status with commutable EQA-samples—five year experience from the Netherlands. Clin Chim Acta. 2012;414:234–40. doi: 10.1016/j.cca.2012.09.027. [DOI] [PubMed] [Google Scholar]
- 17.Perich C, Ricós C, Alvarez V, Biosca C, Boned B, Cava F, et al. External quality assurance programs as a tool for verifying standardization of measurement procedures: Pilot collaboration in Europe. Clin Chim Acta. 2014;432:82–9. doi: 10.1016/j.cca.2013.11.005. [DOI] [PubMed] [Google Scholar]
- 18.Jones GR, Sikaris K, Gill J. ‘Allowable Limits of Performance’ for External Quality Assurance Programs - an Approach to Application of the Stockholm Criteria by the RCPA Quality Assurance Programs. Clin Biochem Rev. 2012;33:133–9. [PMC free article] [PubMed] [Google Scholar]
- 19.Koerbin G, Sikaris KA, Jones GR, Ryan J, Reed M, Tate J, AACB Committee for Common Reference Intervals Evidence-based approach to harmonised reference intervals. Clin Chim Acta. 2014;432:99–107. doi: 10.1016/j.cca.2013.10.021. [DOI] [PubMed] [Google Scholar]
- 20.Infusino I, Panteghini M. Standardisation in clinical enzymology. eJIFCC. 2009;20(3) [PMC free article] [PubMed] [Google Scholar]


