
Figure 2. All-cause mortality Hazard ratios (HR) for HbA1c values.
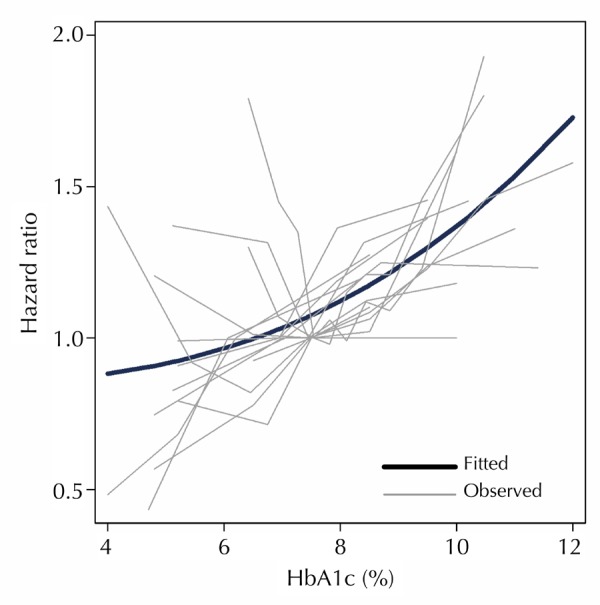
Observed studies plotted against the predicted curve from regression analysis for studies with HRs reported for more than two HbA1c categories.
Official websites use .gov
A
.gov website belongs to an official
government organization in the United States.
Secure .gov websites use HTTPS
A lock (
) or https:// means you've safely
connected to the .gov website. Share sensitive
information only on official, secure websites.
Observed studies plotted against the predicted curve from regression analysis for studies with HRs reported for more than two HbA1c categories.