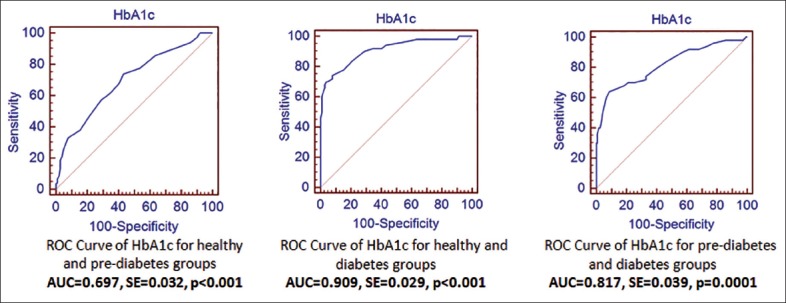
Figure 2.

Receiver operating characteristic (ROC) curves of hemoglobin A1c (HbA1c) for pairwise comparisons. (a) ROC curve of HbA1c for healthy and prediabetes groups (areas under curve [AUC] = 0.697, standard error [SE] = 0.032, P < 0.001). (b) ROC curve of HbA1c for healthy and diabetes groups (AUC = 0.909, SE = 0.029, P < 0.001). (c) ROC curve of HbA1c for prediabetes and diabetes groups (AUC = 0.817, SE = 0.039, P = 0.001)
