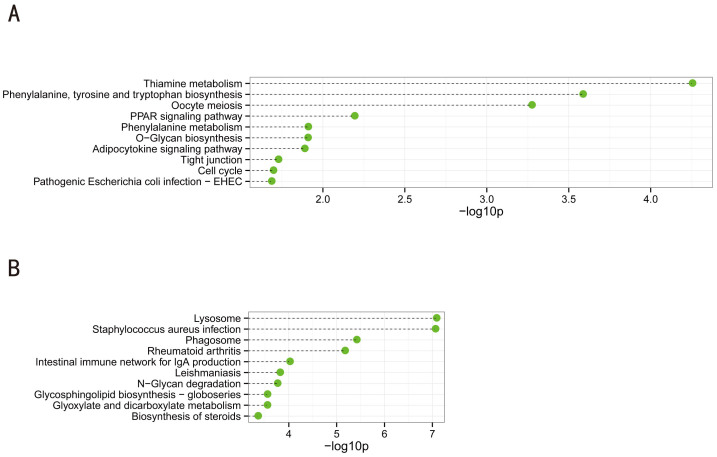
Figure 4. Top 10 categories of KEGG pathways associated with the significantly downregulated (A) and upregulated genes (B).
Dashed lines represent the p-values for the 10 top-ranked categories of KEGG pathways associated with the downregulated (upper panel) and upregulated (lower panel) gene lists. The p-values were calculated using hypergeometric tests and corrected by Benjamini-Hochberg adjustment. The p-values are expressed as the negative logarithm (base 10).

